Traders have been using indicators for many decades. It is advantageous to novice traders unfamiliar with technical analysis or price action trading. Even professional traders religiously stick to price action, cannot trade without one or two indicators. It is a type of secret weapon.
VWAP is one of those secret tools seasoned traders like to use to identify possible entries into the market. Finding the correct entry is crucial in forex trading as it can help you make good profits, whereas a bad entry can lead to massive drawdown and losses.
This article will detail the VWAP indicator and how traders can use it to their benefit.
Three things to know before starting:
- VWAP is helpful to determine the best price and identify the trend of the market.
- The upper and lower band acts as dynamic support and resistance levels.
- Traders use it as a benchmark price to gauge where to buy an asset.
Understanding VWAP indicator?
The traders use VWAP to discover the fair value of an asset to know the best price at which they can buy an asset.
VWAP stands for Volume-weighted average price and refers to the mean value of an asset over a specific period in terms of volume. The trading asset here can be a stock or forex pair. Furthermore, although you may use VWAP in different scenarios and trading styles, it is best suited for intraday trading.
Large institutional investors often use the VWAP to enter or exit a stock. Therefore, it is used not only in forex trading but also in other types of securities.
However, when large institutions buy a currency pair below the VWAP, the price is moved towards the average. VWAP can be used to identify the trend of an asset; in addition, it can be helpful to identify the dynamic support and resistance levels.
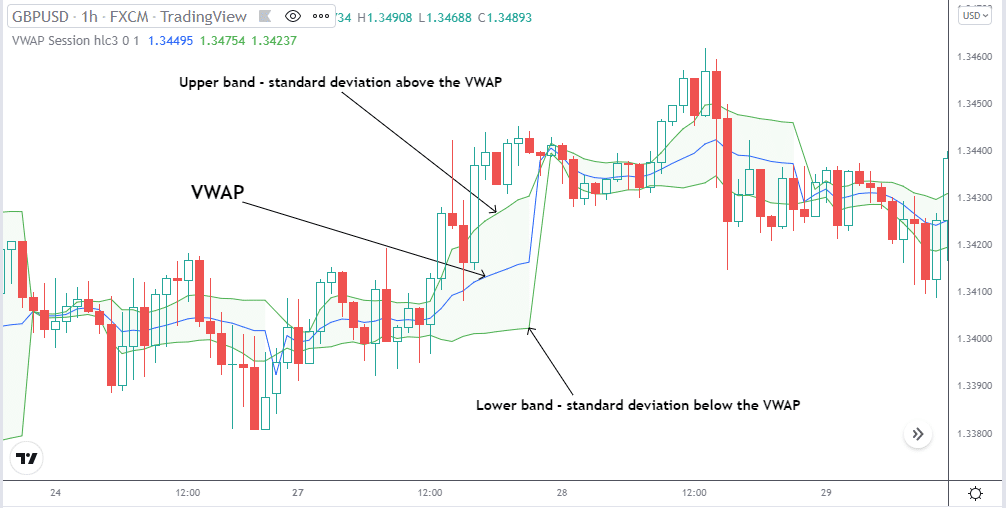
The VWAP usually appears as three lines on most charting platforms. The upper band works as resistance or overbought level, and the lower band acts as a support or overbought level.
Why is it best for traders?
The VWAP is available on most price charting software programs, and there is no need to calculate it. It appears as a line that is either below or above the asset’s price.
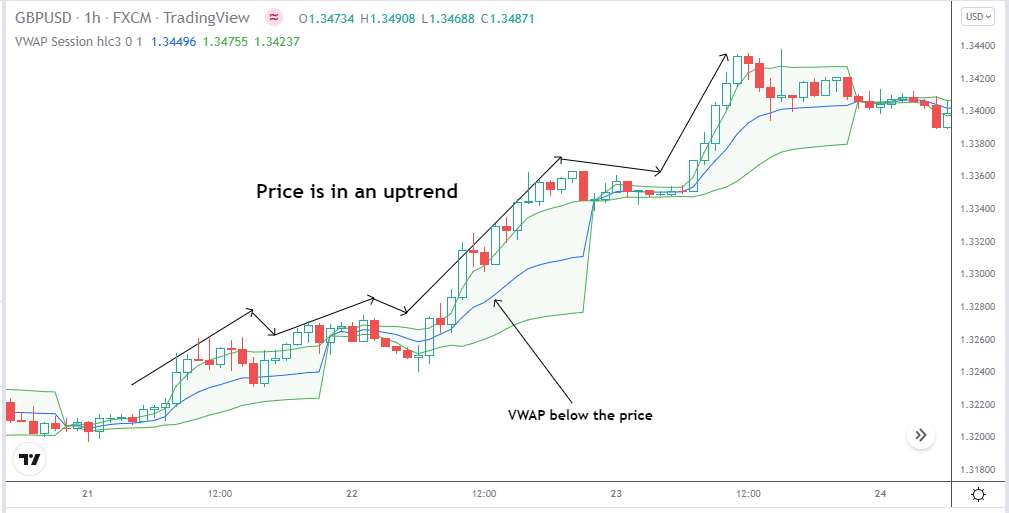
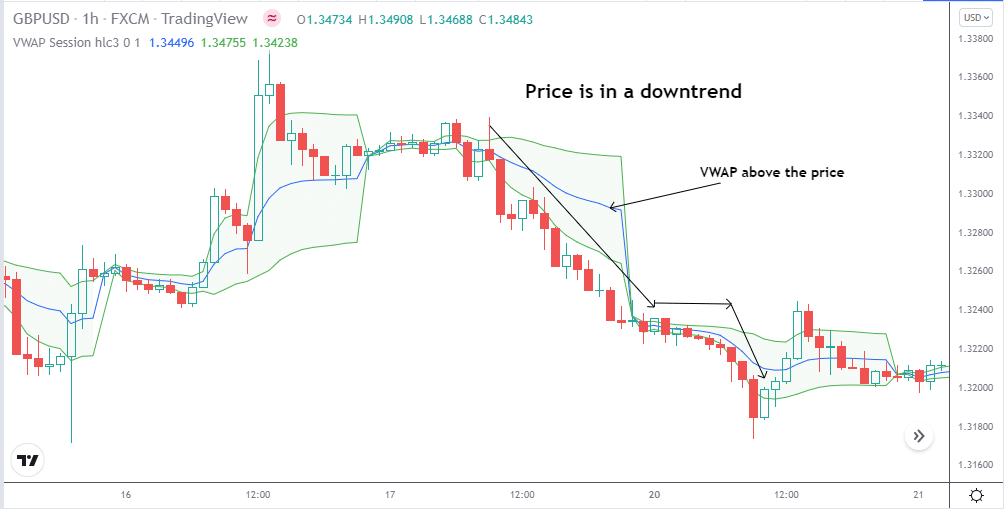
If the VWAP is below the price, then the asset is too expensive, and if it is above the price, the asset is cheaper.
Therefore, it is beneficial for traders to assess the best price to buy or sell a forex pair. If the VWAP is below the price for an extended period, we can conclude that the price is on an uptrend.
Similarly, if the VWAP is above the price for an extended period, the price is in a downtrend.
Calculating the VWAP indicator
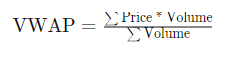
The calculation behind the VWAP is relatively straightforward; as we mentioned, it is the average price per volume of a security within a specific period.
The cumulative average price multiplies with the volume and divides by the cumulative volume for the asset.
The upper and lower bands are a specific standard deviation from the VWAP line. The standard deviations are calculated based on the difference between the price of the asset and the VWAP.
VWAP trading strategies
When finding good trade entries, it is best to use the VWAP in combination with other indicators. This strategy will combine the VWAP with the RSI indicator.
These are the steps to follow when finding a buy entry in an uptrend:
- The first step is to identify the market trend.
- Secondly, we wait for the RSI to show an oversold condition for a buy entry.
- The third step is to wait for the price to pull back to the VWAP.
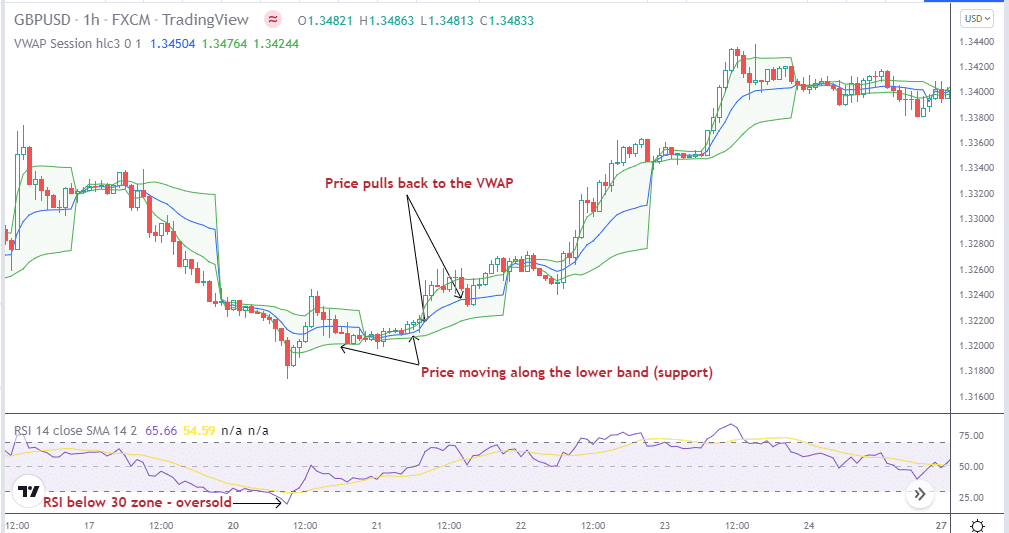
In the above scenario, we can see that the RSI is below the 30 zone, which indicates an oversold condition. The price also moves along the lower band, which acts as a dynamic support level. Furthermore, the price pulls back to the VWAP, the perfect entry for buying in an uptrend.
A buy entry is possible when the price reaches the VWAP, and the stop loss can be 20 to 30 pips below the VWAP line. In an extended uptrend, traders can take profit 50 to 100 pips from entry or the next major resistance level. It is always advisable to use a trailing stop to protect running profits should the market reverses.
Pros and cons
| Worth to use | Worth to getaway |
| Perfect for identifying market trend VWAP helps determine the overall market direction at higher time frames. | Not good at lower time frames Due to the price movements at lower time frames, the VWAP will change often and therefore is not a good indicator to use at lower time frames. |
| Ideal for spotting entries You can find entry levels using dynamic support and resistance levels. | Volume inconsistency When the market volume fluctuates too, frequently, the VWAP becomes an inaccurate measure. |
| Future price predictions You can profit better from the trade setup by adding another indicator and confluence. | Lagging indicator VWAP is a lagging indicator. Therefore, it calculates previous price points. Furthermore, as the volume increases during the day, the lagging becomes bigger. |
Final thoughts
Considering the mechanism behind the VWAP and what you can identify from the market when using it effectively, it is a powerful tool for any trader to have in their skillset. However, like all indicators, you should have a basic understanding of the market structure. Furthermore, in the case of VWAP, market volume plays a significant role. In addition, volume is crucial to forex traders, and you can undoubtedly benefit from using VWAP.