Trading without indicators is called price action or naked, traded by looking at the market price and current happening.
Using this type of trading, Nail Fuller won the million-dollar trader competition with an impressive 369% return on investment. Market participants from different communities are jumping and starting using price action rather than indications for better trading and profits.
Do you also want to know how you can trade the FX without using indicators? This article will help you to learn how to do it.
Three things to know before start:
- Trading without indicators is called naked trading.
- This type of trading requires you to know about support, resistance, candlestick, price patterns.
- Nothing is full proof in trading; FX trading needs practice and consistency.
Can forex traders avoid indicators?
This is probably one of the most asked questions on the internet by traders. And the answer is absolute yes; in any form of trading, you can avoid indicators.
A vast number of market participants have already started trading using the naked chart, which means trading without any indicator and buying/selling assets by looking at the overall trend and price movement to execute the trade.
In price action technical analysis, you will use different candlestick and price patterns along with support and resistance (S&R). Thus, it will allow you to see the current market happening and not follow the historical data.
What is the best trading strategy without indicators?
Most of the indicators are lagging and do not work all the time; thus, choosing the right price action strategy will give you that edge over others in the market.
There are several candlesticks and price patterns in FX trading, but using it all the time does not make sense as there are times that it won’t work. That is why you must know when, where, and how to use it to make a winning trade.
This article will go through three forex trading strategies that will not need any indicator to trade.
How to make it work?
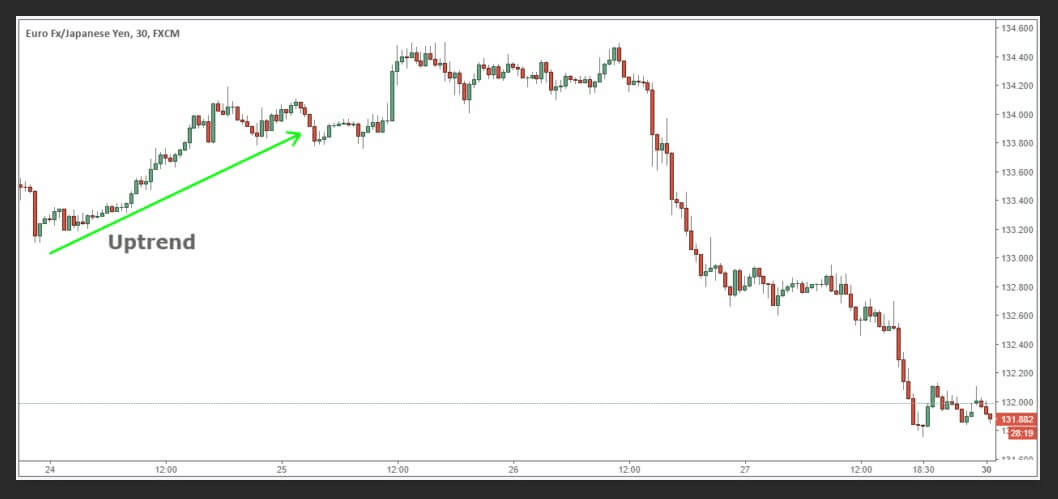
Now, as you won’t use any indicator, you must know how to read the overall market trend, and you will do it by moving to the daily time frame and seeing if the price is making higher-high, higher-low, or lower-high,lower-low.
If the price is making highs, it is an uptrend; while it is making lows, it is a downtrend. After knowing the trend, move to a 4H time frame to draw your S&R and then to 1H to look for price patterns and trade execution.
1. Trading double top
It is a bearish pattern, and you will find it at the top of the price chart.
How to trade double top:
- Wait for the price to come near resistance.
- When the price will touch the resistance once, wait for it to go down again and watch if it breaks the swing low in 4H.
- If the price breaks the low, wait for it to form a new lower high; if it doesn’t do it, wait for it to touch the resistance.
- The second time when the price touches the resistance, wait for the price to come down and break the swing low.
- Take the buy position on the break of the swing low.
What risks to avoid?
You must avoid entering the trade if there is no proper break of low. Sometimes the market will miss touching the resistance; avoid taking that time. There must be some confluence to make trade more accurate and worth taking.
Example
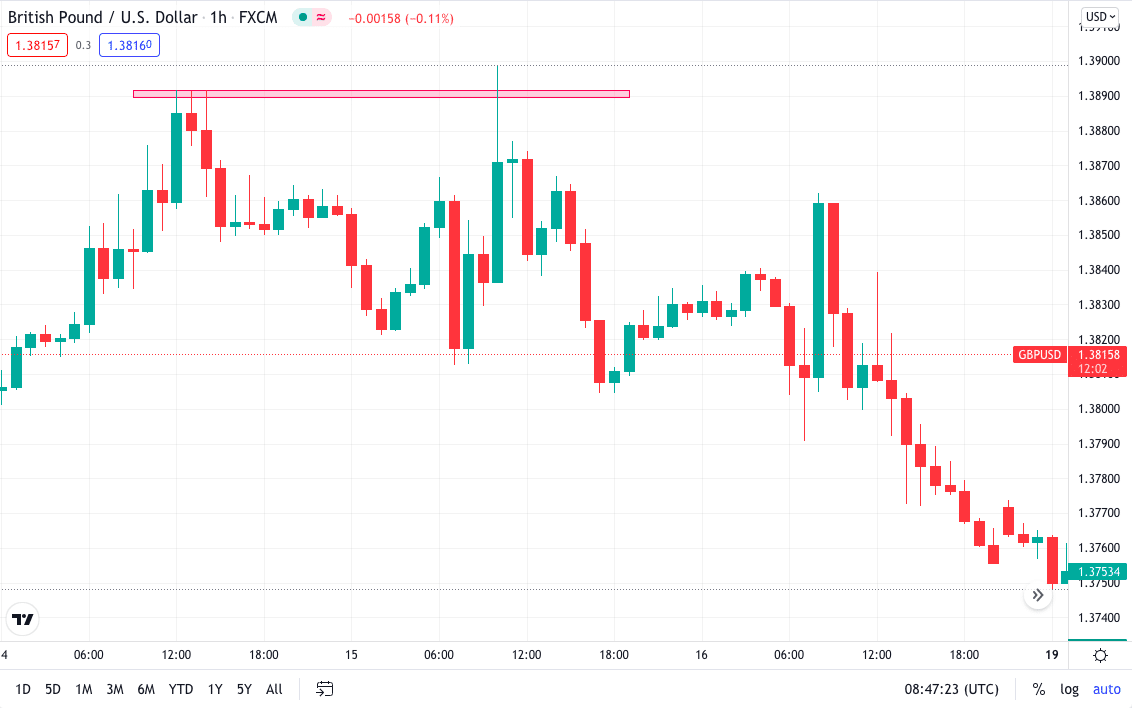
Below, the 4H chart of GBP/USD shows the price-making double top pattern. You can see the price touched the resistance once, went down, and then again came back to touch the resistance for the second time.
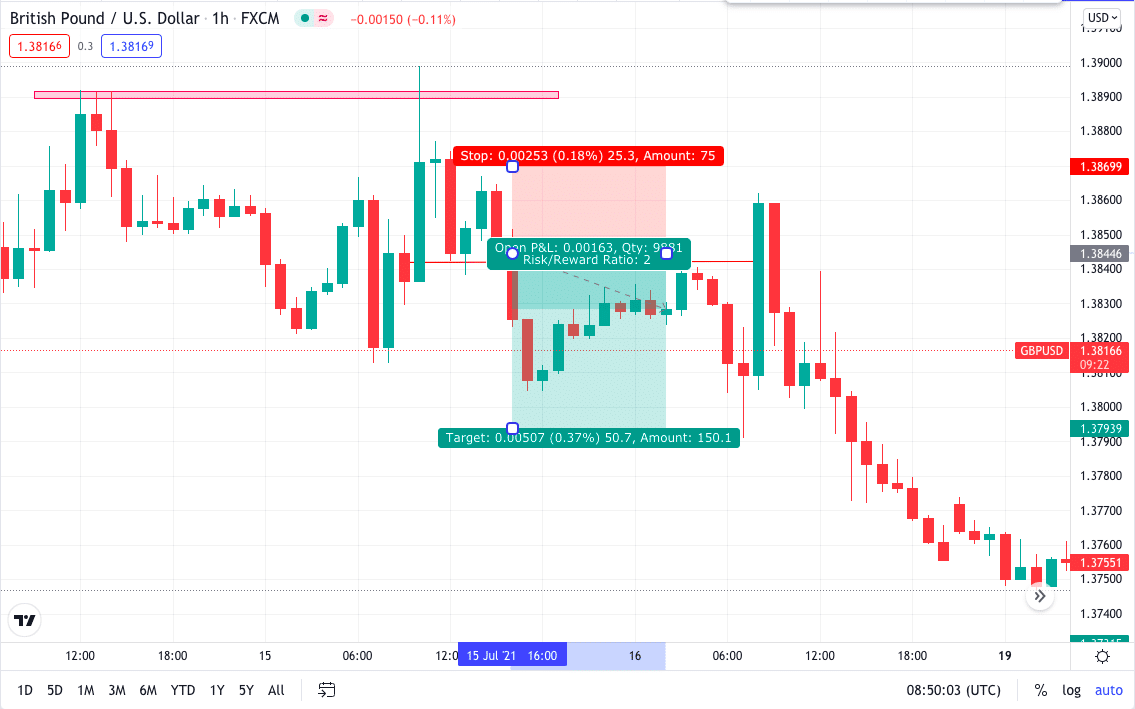
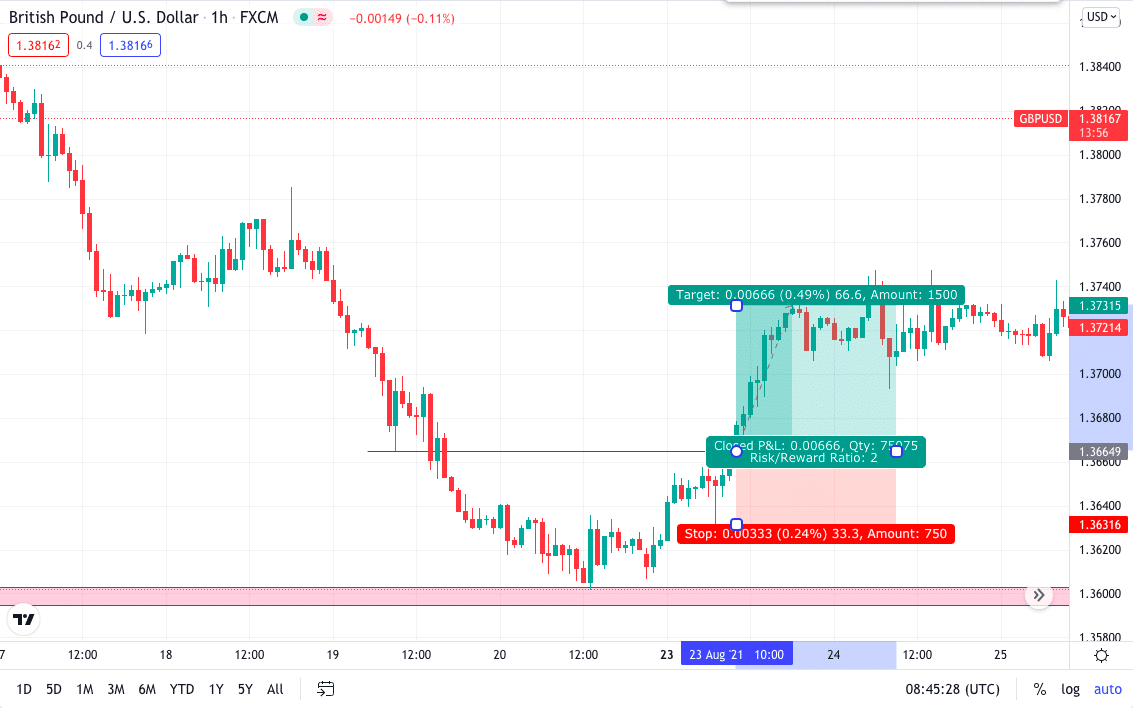
The below 1H chart of GBP/USD shows the price breaking the swing low, placing your stop loss 3-4 above the high candle, and taking the profit at 1:2 reward.
2. Trading double bottom
It is a bullish pattern, and you will find it at the bottom.
How to trade double bottom:
- Wait for the price to come near support.
- When the price touches the support once, wait for it to go up and watch if it breaks the swing high in 4H.
- If the price breaks the high, wait for it to form a new higher high; if it doesn’t do it, wait for it to touch the support again.
- The second time when the price touches the support, wait for the price to go up down and break the higher high.
- Take the sell position on the break of the swing high.
What risks to avoid?
You must avoid entering the trade if there is no proper break of high. Sometimes the market will miss touching the support, avoiding taking that time. There must be some confluence to make trade more accurate and worth taking.
Example
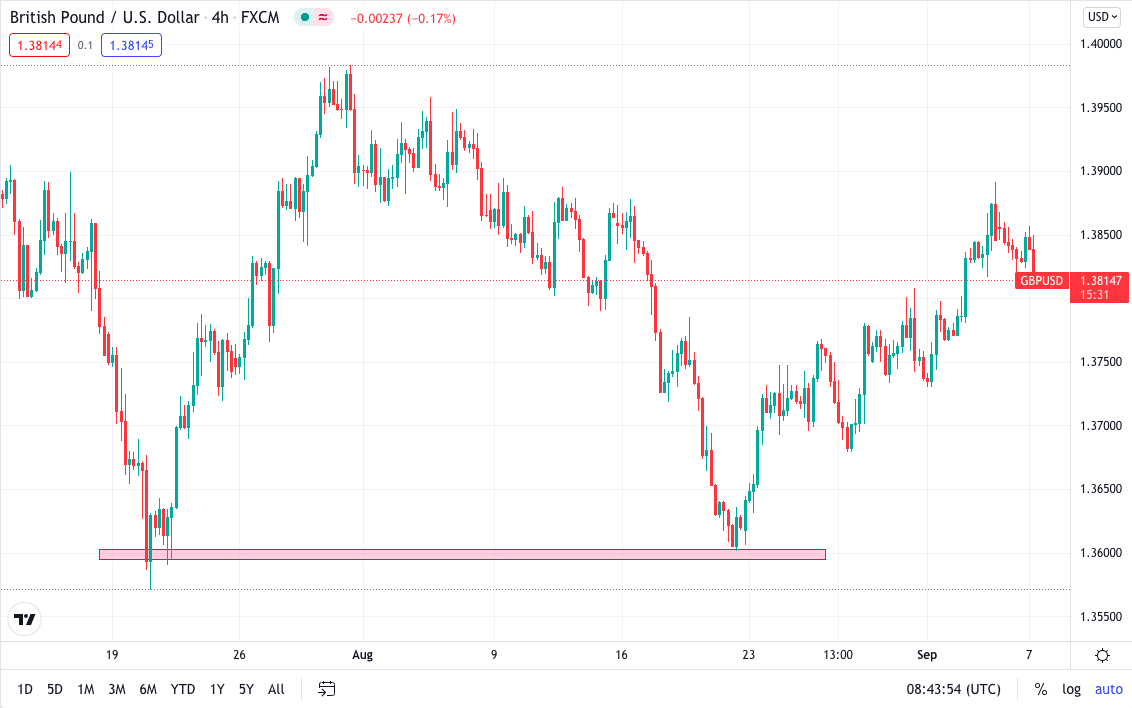
Below, the 4H chart of GBP/USD shows the price-making double bottom pattern. You can see the price touched the support once, went up, and then returned to touch it for the second time.
The below 1H chart of GBP/USD shows the price breaking the swing high, placing your stop loss 3-4 below the low candle, and taking the profit at 1:2 reward.
3. Breakout strategy
This strategy allows you to gain a good reward for your risk.
How to trade double bottom:
- Find the currency pair that has the price moving in a sideways direction.
- Draw a rectangle box and wait for the price to break above or below the box.
- Once the price breaks the box, it must break the swing high or the low.
- Once the break is successful, wait for the price to retest the break zone.
- Take the trade at the retest and place your stop loss 3-4 pips away from the previous candle.
What risks to avoid?
The price does not always retest the break zone. It might break and make a significant move in any of the directions. Do not try to jump into the trade just by seeing the break of structure.
Example
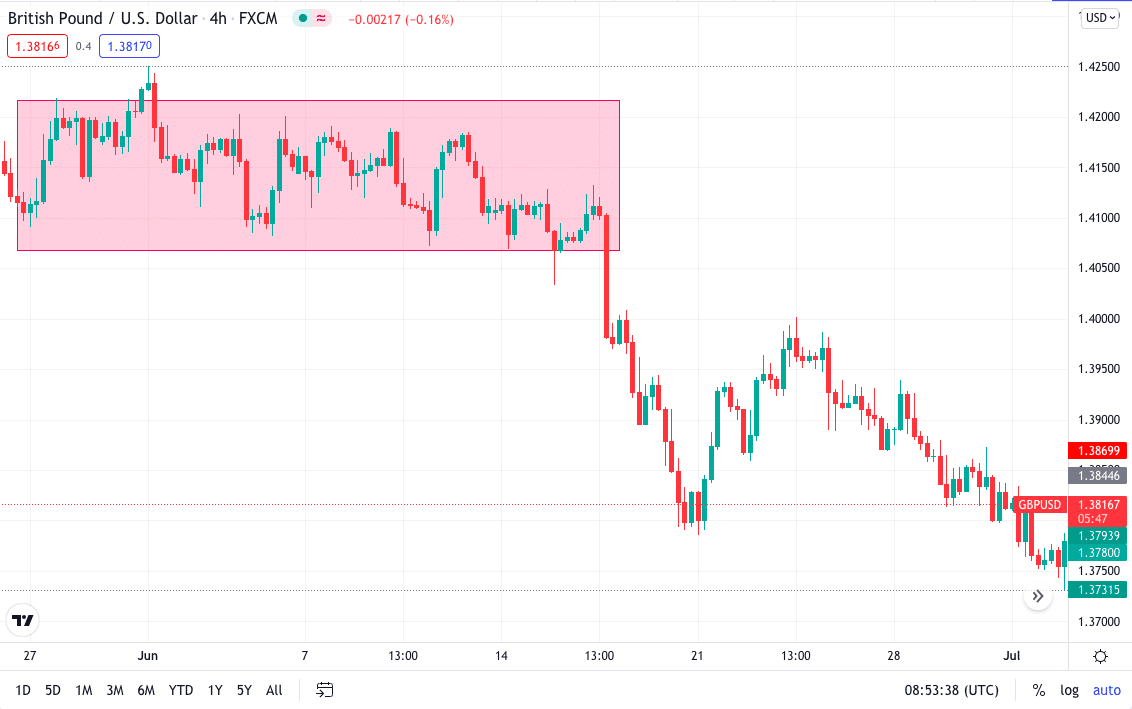
The below 4H chart of GBP/USD shows the price moving in a sideways direction. You can see the price was not able to break either the high or the low properly. After waiting for a while, you can see the price broke below the structure.
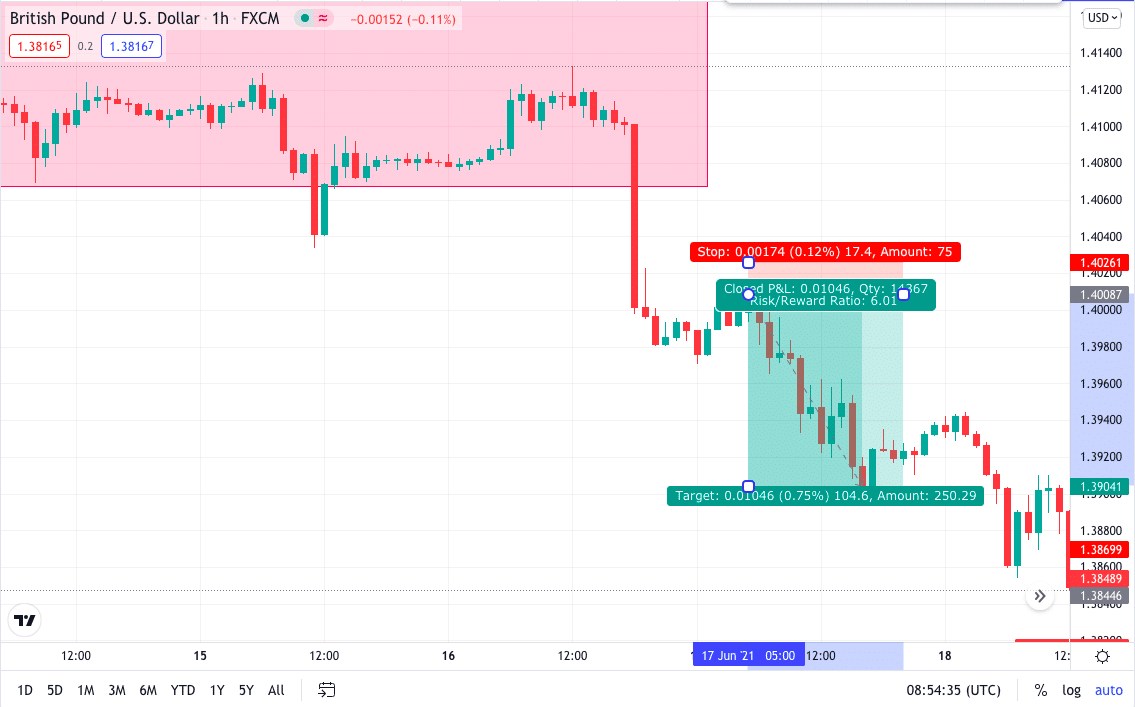
The below 1hr chart of GBP/USD break of structure. The market then came up for retest but was not a promising one. Still, here is a trading opportunity when the price pulled back and made a lower high. Place your stop loss at 2-3 pips above the previous high candle and take profit will be 1:2 reward.
Pros and cons
As told, all glitters are not gold; even price action has few drawbacks that you must look at before going all in one.
| Worth to use | Worth to getaway |
| • Analyze market in-depth This style of trading will help you better analyze the market because you won’t depend on any specific indicator to signal you for buying or selling trade. • Market sentiments Knowing what is happening in the market is crucial before entering any trade. Candlesticks rejections will help you figure out if it’s the buyer’s market or the seller’s. • Better trade entry Nothing is more important than entering and exiting a trade at the right time; price action gives better trade entry than lagging indicators. | • Hard to find the market trend Indicators compared to price action make it easy to find the market trend. • Fake breakouts There are times when the market makes unwanted moves giving you false entry and then taking you out of the trade. • Overwhelming information Beginner traders sometimes overlook the candles and patterns, taking more unwanted information from the market. |
Final thoughts
Naked trading is a must known technique for every trader as following the indicators for a long time won’t make you a better trader. An area of confluence must back any strategy that does not use indicators to make any system better and accurate. Few traders use the naked chart for analysis and also indicators for extra confirmation.