The price of metals, such as copper, nickel, and zinc, should benefit from rising demand. Mining companies have made huge profits over the past year. Many analysts reckon that demand for critical minerals such as lithium, cobalt, and rare earth might increase by 400-600% over the next few decades.
Some analysts excitedly suggest that lithium could see demand rise by more than 40 times between now and 2040.
Exchange-traded funds are an easy way to play the sector. Investors that have embraced industrial miners’ ETFs or those mining ETFs featuring a mix of industrial and precious metals have endured middling returns and elevated volatility.
Here are some mining ETFs to consider and ideas for dealing with funds over the near term with those risks in mind.
How does it work?
There are several indices available to invest with ETFs in mining companies. Besides, the size of the companies, especially the share of revenues from mining, is different from index to index. This guide will allow you to find the most suitable ETFs by ranking them according to your preferences.
Top three things to know before starting:
- The mining industry has significantly underperformed the broader market over the past year.
- When choosing a mining ETF, one should consider several other factors and the methodology of the underlying index and a fund’s performance.
- If you’re looking to add precious metals exposure to your portfolio, the gold and silver miners are the way to go.
Best mining ETFs to buy in 2022
For better comparison, you will find a list of funds with details on size, cost, age, income, expense ratio, dividend yield, returns, ESG rating, etc.
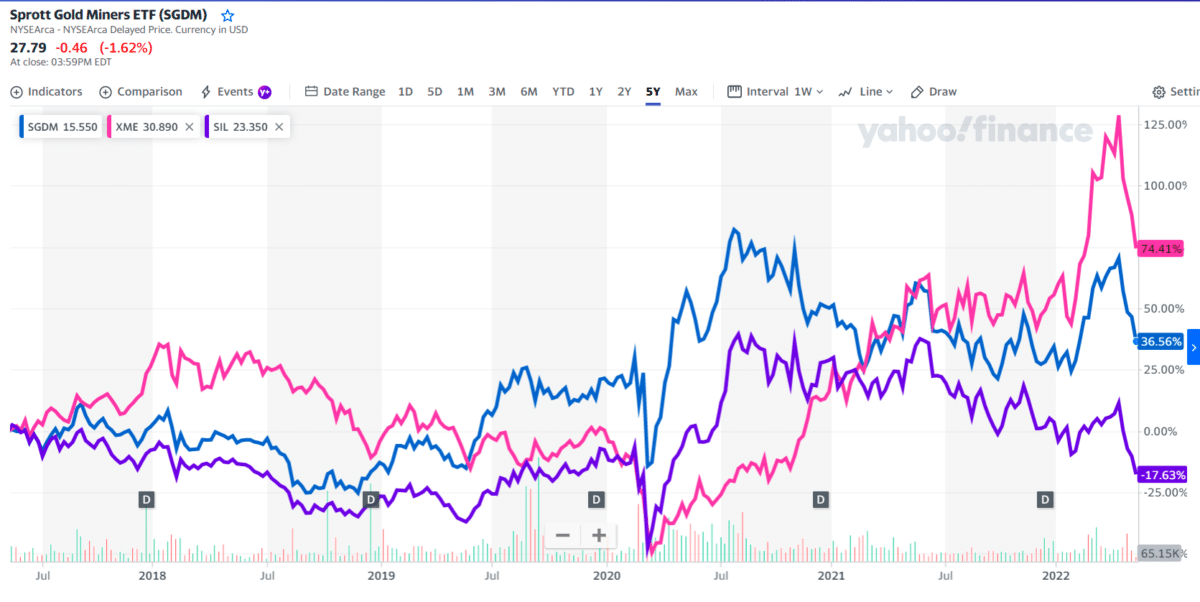
1. Global X Silver Miners ETF (SIL)
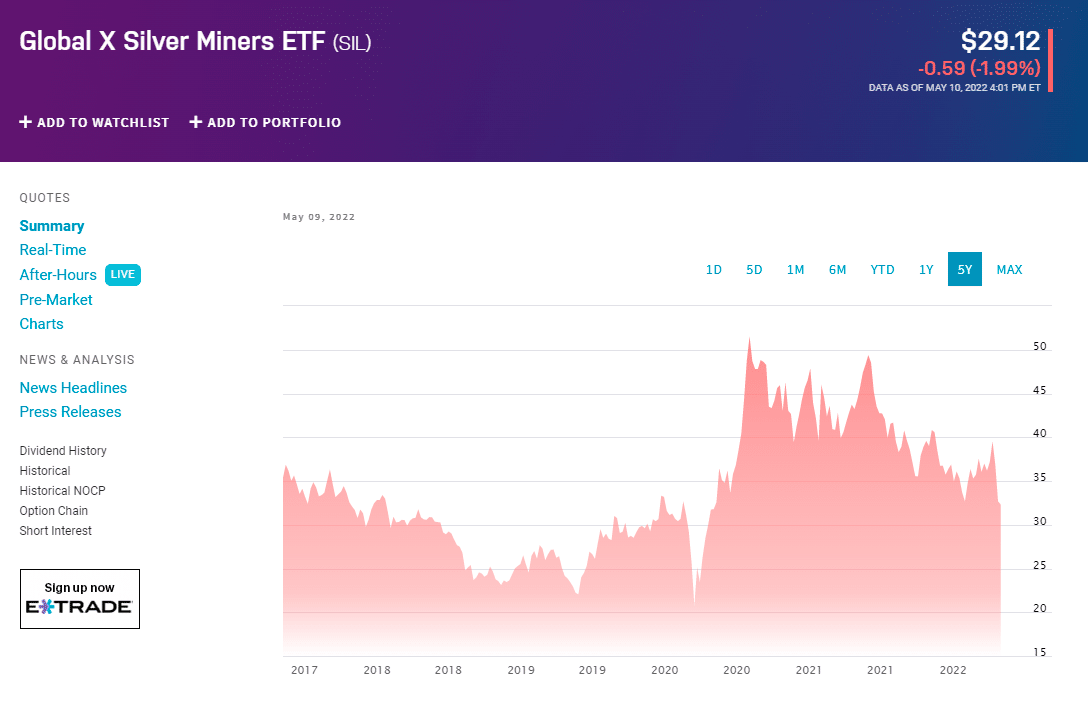
Launched in 2010, SIL has been managed by Nam To since March 1, 2018, at Global X Funds. It is the largest fund targeting silver miners. It aims to track the equity market performance of global companies in the silver mining industry, including those engaged in silver mining and closely related activities such as exploration and refining. To qualify, a significant part of the company’s revenues generated must come from silver mining and closely related activities, such as exploration or refining. Qualifying components are market cap-weighted.
Like gold mining ETFs, SIL reacts to silver’s price action. If some recent, ambitious forecasts prove accurate, that will be beneficial to SIL owners. Like other mining ETFs out there, SIL is a volatile bet.
Dividend yield
The fund has a dividend yield of 2.01% for May 2022.
Holdings
Top 10 countries: Canada 67.26%, United States 9.56%, United Kingdom 7.77%, Peru 5.87%, Korea Republic 5.35%, Mexico 3.13%, Australia 1.07%.
Expense ratio
The fund is non-diversified. Its expense ratio is above average compared to funds in the Equity Precious Metals category. SIL has an expense ratio of 0.65%, which is 19% higher than its category.
Returns (annualized)
The fund has returned -19.2% over the past year and 12.5% annually over the past three years, 0.2% per year over the past five years, and -5.3% per year over the past decade. Recently, in April 2022, it returned -9.3%. The fund has an R-squared of 35%, a beta of 1.30, and a standard deviation of 39.5%. It has a high total risk rating.
The fund does not have an ESG score.
2. Sprott Gold Miners ETF (SGDM)
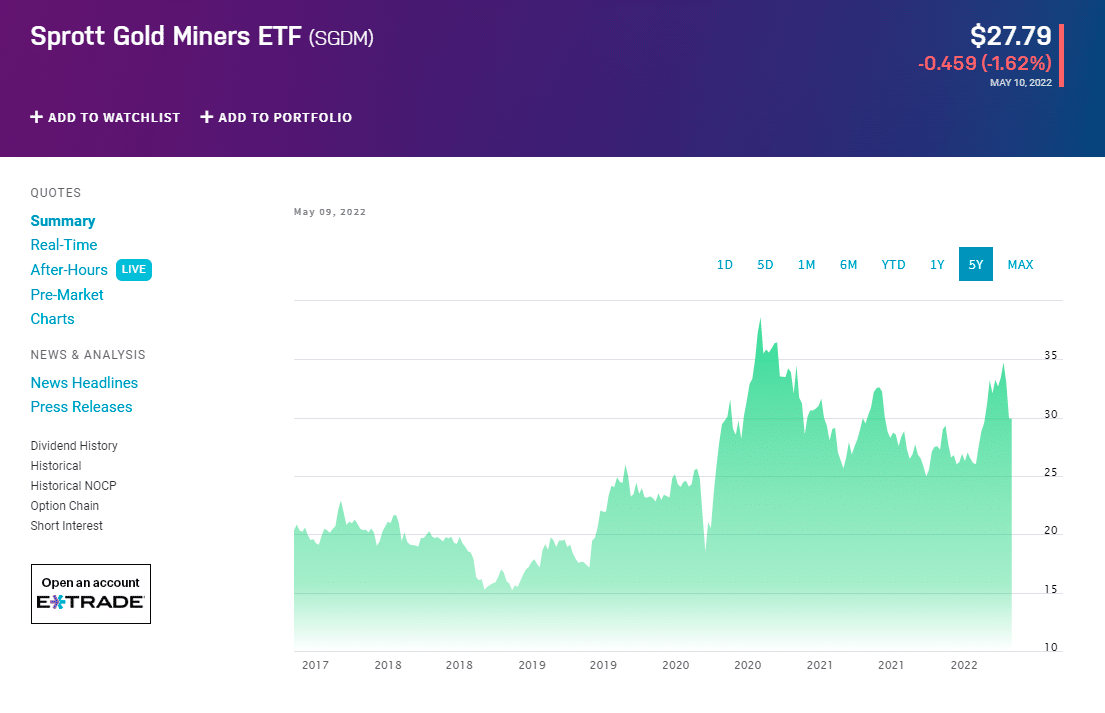
The fund was launched in 2014 and has been managed by Ryan Mischker since March 31, 2015, at Sprott. The fund tracks the Solactive Gold Miners Custom Factors Index, which comprises larger-sized gold companies whose stocks are listed on Canadian and major US exchanges. The index focuses primarily on companies with the highest revenue growth and free cash flow yield and the lowest long-term debt-to-equity ratio.
Dividend yield
The fund has a dividend yield of 1.22% for May 2022.
Holdings
72.5% of SGDM holdings are based in Canada, with the bulk of the remainder found in the US. A small portion of the portfolio includes companies based in South Africa, the UK, and Australia.
Expense ratio
The fund is non-diversified. Its expense ratio is average compared to funds in the Equity Precious Metals category. The fund has an expense ratio of 0.50%, 9% lower than its category.
Returns (annualized)
The fund has returned 7.9% over the past year and 19.6% annually over the past three years. Recently, in April 2022, SGDM returned -8.0%. The fund has an R-squared of 23%, a beta of 1.03, and a standard deviation of 38.8%. It has a high total risk rating.
The fund does not have an ESG score.
3. SPDR S&P Metals & Mining ETF (XME)
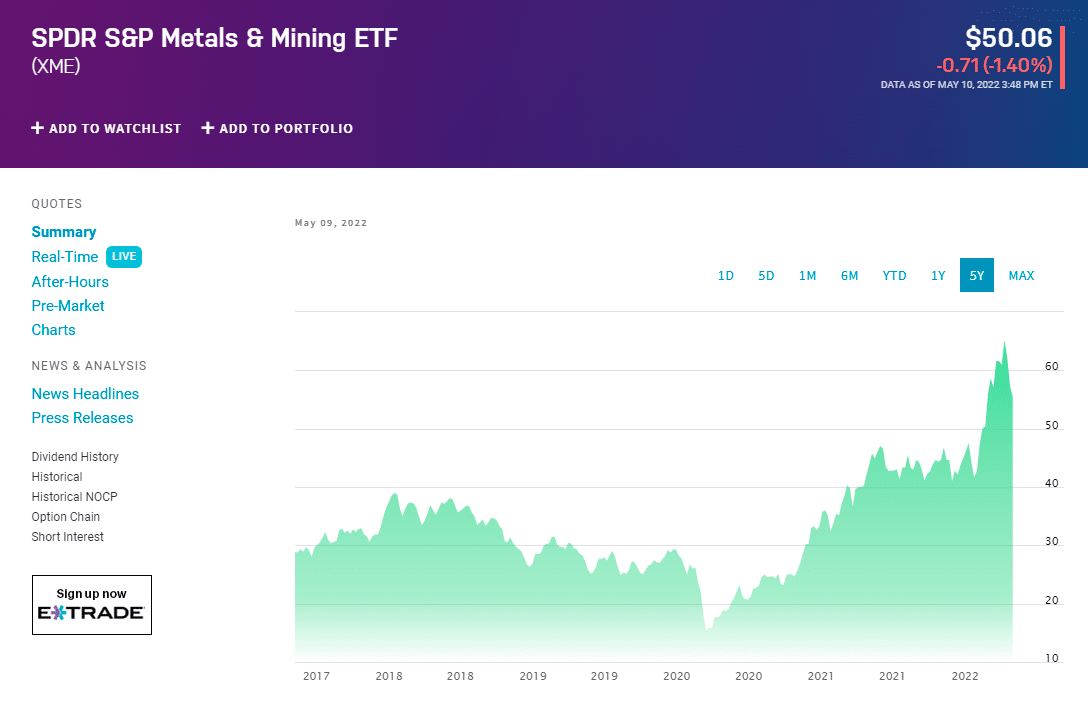
The fund was launched in 2006 and managed by Michael Feehily since October 31, 2011, at SPDR State Street Global Advisors. It is a prime example of a struggling mining ETF. Those struggles can be attributed to the fund’s diversified approach, meaning its roster comprises industrial and precious metals producers.
About half of XME’s weight is allocated to steel producers, more than double the weight the fund assigns to precious metals miners. Steel prices are volatile and vulnerable to the significant downside if major global economies are stalling or flirting with recessions.
Couple that with XME’s penchant for being much more volatile than other industry funds, and this mining ETF looks more like a trade over the near term, not an investment for long-term players. Unless you can actively monitor positions in XME, stay on the sidelines with this mining ETF for the time being.
Dividend yield
The fund has a dividend yield of 0.54% and paid $0.29 per share in the past year. The dividend is paid every three months and the last ex-dividend date was Mar 21, 2022.
Holdings
Top 10 holdings: Steel Dynamics Inc. 5.51%, Nucor Corp 5.30%, Arch Resources Inc Class A 5.04%, Reliance Steel & Aluminum Co 4.88%, Allegheny Technologies Inc 4.75%, Commercial Metals Co 4.70%, Cleveland-Cliffs Inc 4.57%, Peabody Energy Corp 4.56%, Royal Gold Inc 4.41%, Newmont Corp 4.39%.
Expense ratio
The fund is non-diversified. Its expense ratio is below average compared to the Natural Resources category funds. XME has an expense ratio of 0.35%, which is 29% lower than its category.
Returns (annualized)
The fund has returned 39.6% over the past year and 26.8% annually over the past three years, 15.3% per year over the past five years, and 3.1% per year over the past decade. Recently, in April 2022, XME returned -8.4%. It has an R-squared of 57%, a beta of 1.66, and a standard deviation of 39.5%. It has a high total risk rating.
The fund does not have an ESG score.
Pros and cons
| Worth to invest | Worth to getaway |
| As measured by the NYSE Arca Gold Miners Index, the gold mining industry has significantly underperformed the broader market. | Gold miner ETFs are more expensive to hold. On average, they have annual management fees of 0.57%, compared with their physically held counterparts, which charge an average of 36 basis points. |
| With the economic recovery showing signs of slowing and inflation risks rising, precious metals look primed to deliver another big year. | Before diving in, ask a certified public accountant (CPA) how buying mining ETFs will affect your particular tax situation. |
| An ETF can track a broader range of stocks or even attempt to mimic the returns of a country or a group of countries. | Vehicles like ETFs that live by an index can die by an index with no nimble manager to shield performance from a downward move. |
Final thoughts
Lithium carbonate prices in China have risen over 75% this year. Battery manufacturers are already showing struggles with supply chains and raw materials costs. One big outfit called Lucid cut its production goal by 35% for 2022, citing ‘extraordinary’ challenges, and Tesla also announced delays to product launches. Rivian has become the latest EV manufacturer to cut production, and European auto manufacturers are struggling with disruption of the supply chain caused by the Ukraine crisis.
No one doubts that governments will still be pumping money into renewables. Soaring energy prices and new technologies are driving up production costs. Despite the current correction, metals will find the bottom, after which another round of growth will begin. Thus, the metals and mining space may have more going for it.