Any trader will agree that finding the volatility and the market’s direction is crucial in any trading.
If you know the trend and volatility of the asset, you are already 30-50% in the winning game, and now your only job is to work on the strategy and the risk management. One indicator to predict the market trend is the Keltner channel. It is a volatility-based indicator used to determine the market direction.
The best thing while using the indicator is the ease of use on any chart and time frame. Apart from trend direction, this tool also helps in providing the trading signals.
Read this article and know how to acquire the best results while trading with the help of this tool.
Three things to know before starting:
- This channel uses EMA and ATR for its calculation.
- It confirms the market trends once they have been established.
- In bullish conditions, the price reached the upper band of this channel while it reached the lower band in the bearish market.
Understanding the Keltner channel
If you are a market participant who is a good piece of knowledge, your eyes and ears must not have missed a technical indicator known as the Bollinger Band. The Keltner indicator is very similar to BB with almost the same structure but only indicator use.
The Keltner channel uses the ATR indicator, while the BB uses standard deviation to produce the trading signals. Chester Keltner first introduced the indicator in the 1960s. It measures volatility by using the ATR.
The indicator has three lines in it:
- The upper and lower bands are the ATR
- The middle band is the EMA
The whole band expands and contracts as volatility (ATR) expands and contracts. The basic working of the tool is to go for a long position if the price breaks above the upper band, while if the price breaks below the lower band, a trader should consider taking a short position.
Why is it best for traders?
It will excite you to know that the Keltner channel, if appropriately used, serves many purposes. Some measure the volatility, determine the current market trend, and spot potential breakouts.
You can also use it to trade pullbacks and reversals. There is no specific rule for a trader to follow while trading with the channel, as they can use this indicator in any trading style. The higher the time frame, the better.
Keltner channel calculation
The channel lays an elastic path where the price swings between the upper and lower bands. A trading signal is created when a break is above or below the top and bottom bands.
The calculation could be easily summarized with the following formula:
- Calculate the middle band value, i.e., 20-day MA.
- Calculate the upper channel line using the following formula: 20-day EMA + (2 x ATR(10)).
- The lower channel line is calculated using: 20-day EMA – (2 x ATR(10)).
Trading with the indicator
They have multiple uses, and how they are used will largely depend on the settings a trader uses. The first thing to know is the market trend through a channel.
| Uptrend | Downtrend | Range market |
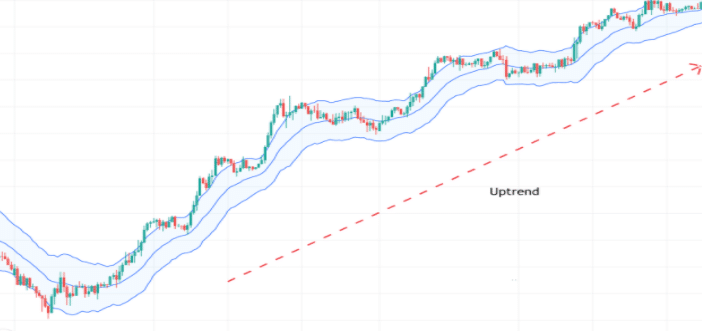
| 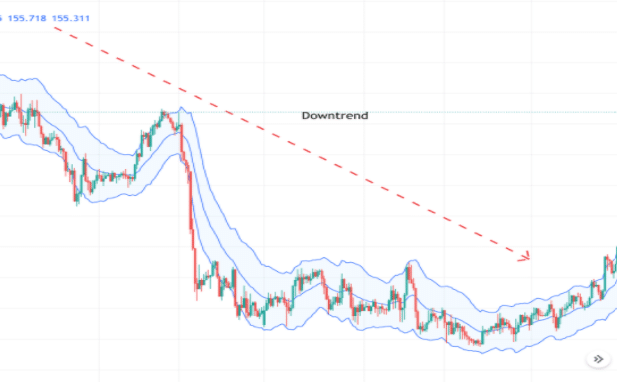
| 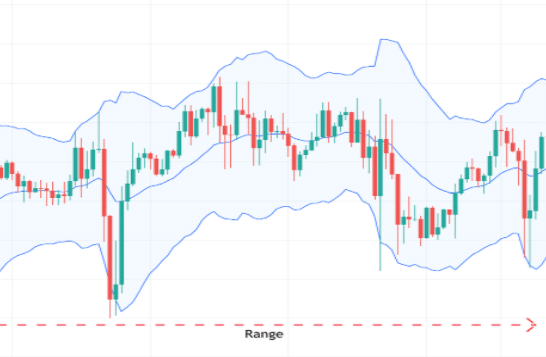
|
Keltner channel trading strategies
Using the indicator alone is not a good idea, producing false signals. To make the best use of it, traders should use it with different indicators.
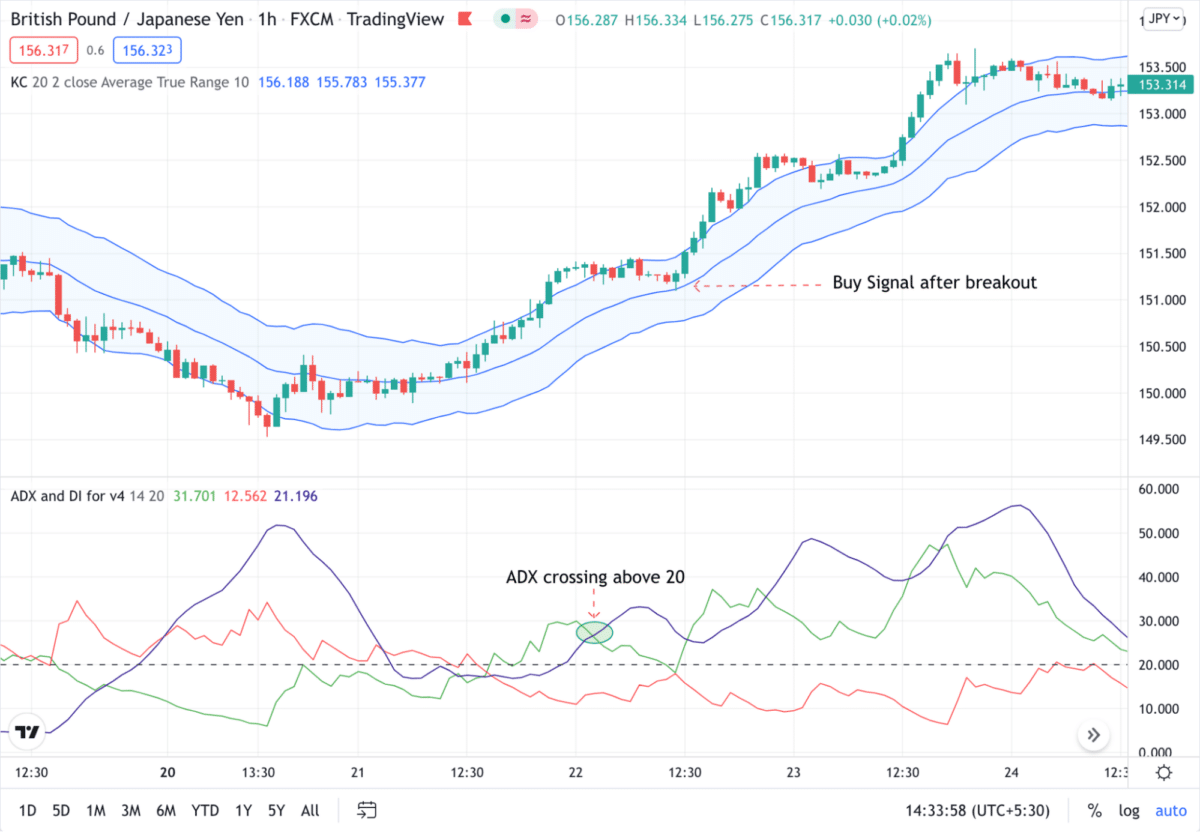
- Breakout
Using Keltner and ADX indicator to trade the breakout. The below GBP/JPY 1hr chart shows how to trade the breakout. Here you can see the price breaking the upper band of the channel, and the ADX indicator shows moving to 25 zones, signifying a buy trading opportunity.
Remember not to hurry and buy as soon as the price crosses the upper band; instead, wait for a pullback and enter for a more reliable trading signal.
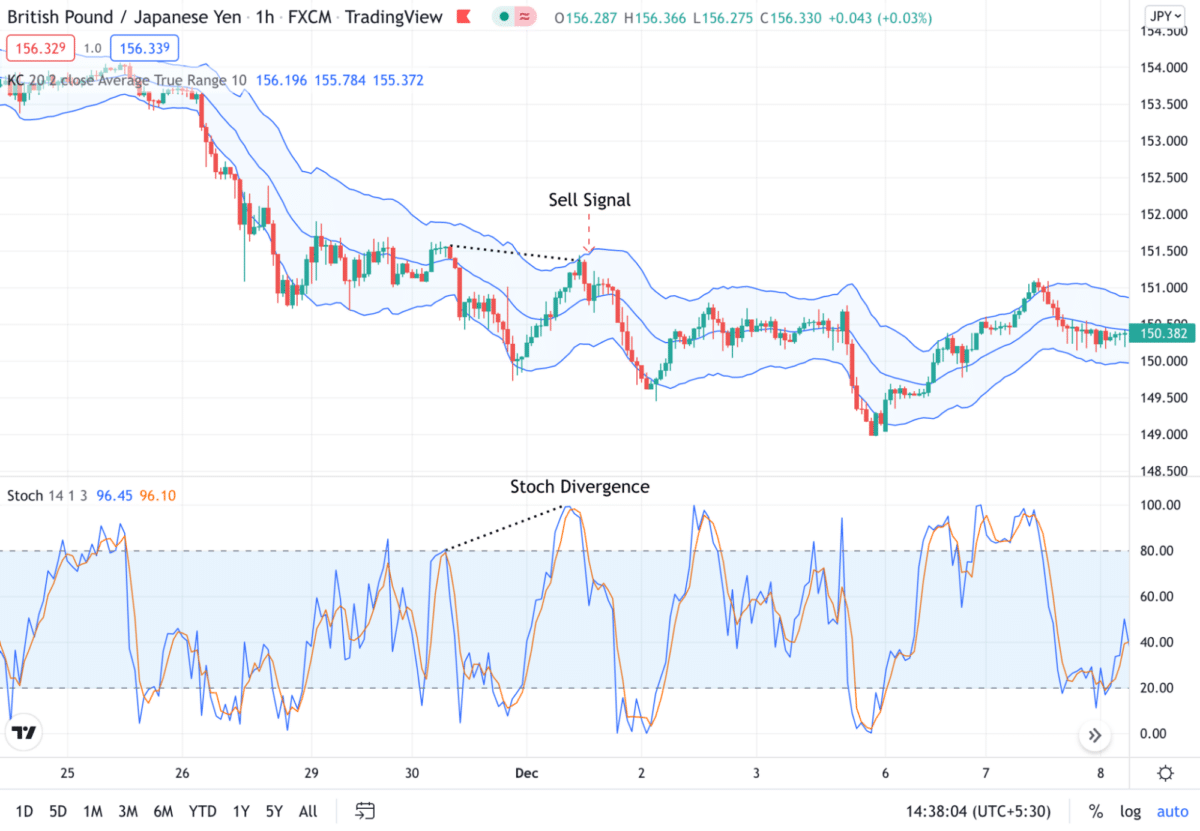
- Pullback strategy
We are applying stochastic to the Keltner channel to look for divergence and spotting trades in an ongoing trend.
In the below GBP/JPY chart, you can see the market is in a downtrend. The stochastic shows divergence, and the price touches the upper band, acting as a resistance.
Traders can take a short-term sell position here and trade until the price breaks the upper band, showing market trend reversal.
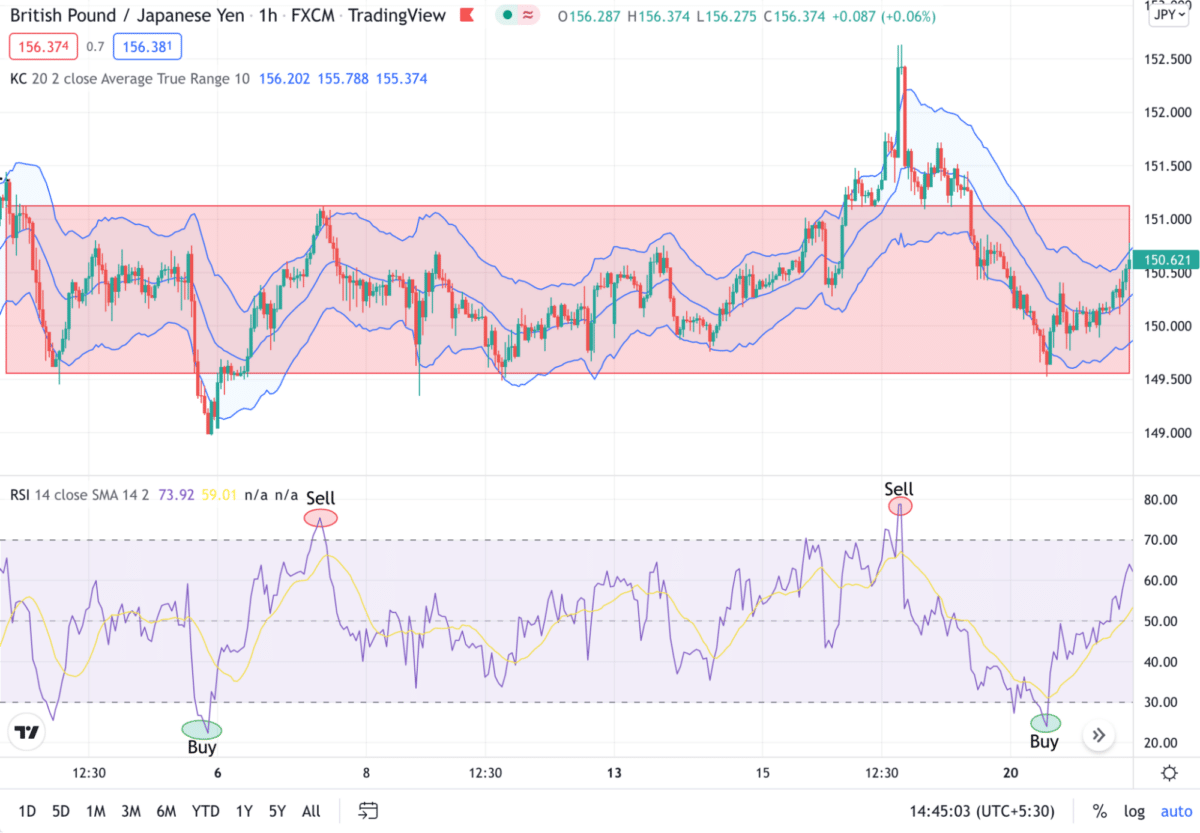
- Consolidation trading
We are applying RSI with the Keltner channel to look for the overbought and oversold zone in the RSI for spotting frequent trading opportunities.
In the below GBPJPY chart, you can see the market is ranging, meaning it does not have a proper up or down movement structure. Hence, traders will look into the RSI for oversold and overbought conditions.
If the line crosses the 70 zone, it is considered the asset is overbought, while if the line goes below the 30 zone, it is an oversold condition. Traders need to buy when oversold and sell when overbought.
Pros and cons
It is a good tool to use, but it is not a holy grail. Below are a few pros and cons that you must look into before starting.
| Worth to use | Worth to getaway |
| It can identify the market direction and potential price breakouts while new trends are still in their earliest stages. | The channel is considered to be a lagging indicator. |
| It can also aid in the placement of stop-loss levels, given the way the indicator can signal the end of a previous trend in market prices. | It is challenging to analyze previous trending moves in the market that will continue in the future with it help. |
| It is an easy-to-use indicator, someone who has used BB before can move with it easily. |
Final thoughts
Initially, the strategy for working with Keltner Channels was straightforward. As soon as the price breaks through the channel and goes beyond it upwards, this signals the need to open long positions since a bullish trend begins, but if the breakout occurs downwards, bears are in force, and a sell order must be created.
Since the channel boundaries corresponded to strong support/resistance levels, the price going beyond them meant a confident breakout, which indicates the possible start of a new trend in the corresponding direction.
However, Keltner developed his indicator when things were much more straightforward. Computers and trading robots were not used for trading, and there were no terminals like MT4 familiar to us yet.
Now, using only this instrument has long become problematic. Thus, the market has grown significantly, has become more complex, and constantly shows false channel breakouts when the price goes beyond it only for a short time and then comes back again.
Therefore, in our time, it is recommended to open positions on its signals only if there is an explicit confirmation from other indicators, such as ADX, RSI, or the MACD oscillator. If you are a price action trader, you may consider taking the trades near support, resistance, or trendline with additional information from the channel.