Millions of individuals worldwide engage in forex trading due to the lucrative prospects of this sphere. Traders exchange a wide range of currency pairs or commodities on this global marketplace. Nonetheless, margin trading carries certain risks and challenges, requiring the utilization of disciplined risk management strategies.
In addition, many beginner traders consider trading to be a sophisticated and overly complex zone. The conception is not true as most long-term successful traders imply simplified strategies and indicators.
Moving averages (MA) are among these most commonly utilized technical indicators among all kinds of traders. This article has discussed the two types of MAs, their specifications, and their comparison.
Three things to know before starting:
- MAs are dynamic averages computed according to past prices.
- Two major types of MAs essentially differ in their price weightage.
- The exponential MA is relatively sensitive to price oscillation, whereas a simple MA gives a stable price outlook.
What are moving averages?
In the trading lexicon, MAs refers to the average price over a specific period. The word “moving” specifies the continuous replacement of previous price data with the recent one for average estimation.
MAs assist the traders in identifying price trends and suitable trade entry/exit points. The two most common types of MAs are:
- Simple moving average (SMA)
- Exponential moving average (EMA)
SMA
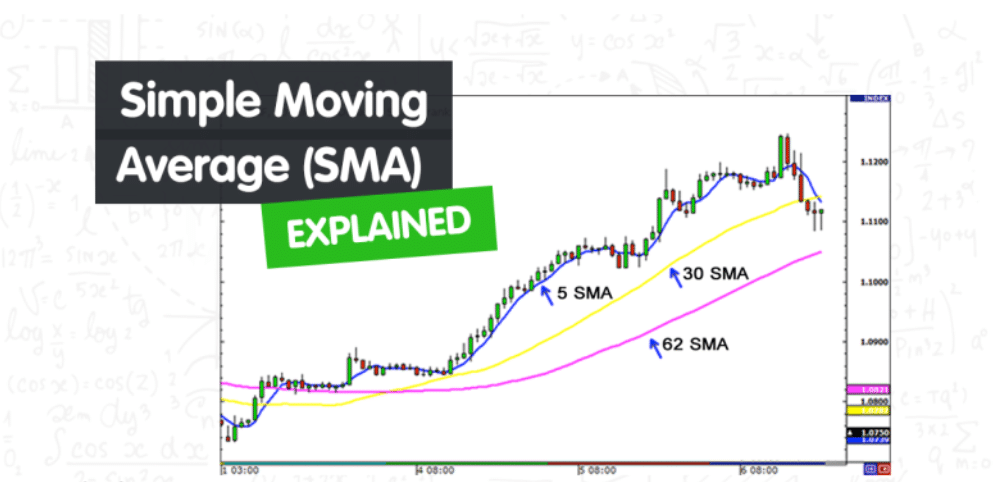
Its value comes out by adding the specific data points or prices and dividing the sum by the total time periods. It is a customizable indicator, and according to their preferences, traders can adjust it for different time periods such as 20-days, 50-days, 200-days, etc.
For example, in a 20-period SMA, the closing prices of the latest 20 days would be added and divided by 20.
Moreover, the SMA is a lagging indicator as it incorporates the previous data. As a result, most traders utilize SMA in association with other oscillators and overlay indicators.
EMA
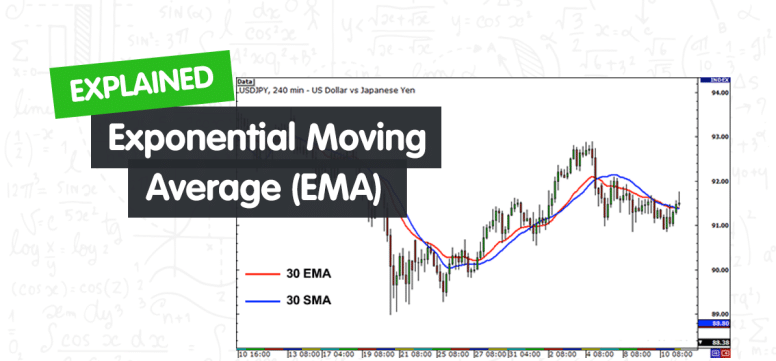
It is an average that gives more weightage to the recent price points. This type of MA is more reactive to price fluctuations as compared to the equally-weighted SMA.
Similar to the other MAs, you can also customize EMA to various periods. Generally, scalpers and short-term traders mainly utilize price-sensitive EMAs to detect the shifting trends timely.
How to trade with SMA and EMA?
Traders can select different period MAs on various timeframe charts concerning their preferences and goals. There is a wide range of MA trading strategies that utilize individual EMAs and SMAs or a combination of both.
We have utilized SMA and EMA crossover strategy in the bullish and bearish trade setups below.
Bullish trade setup
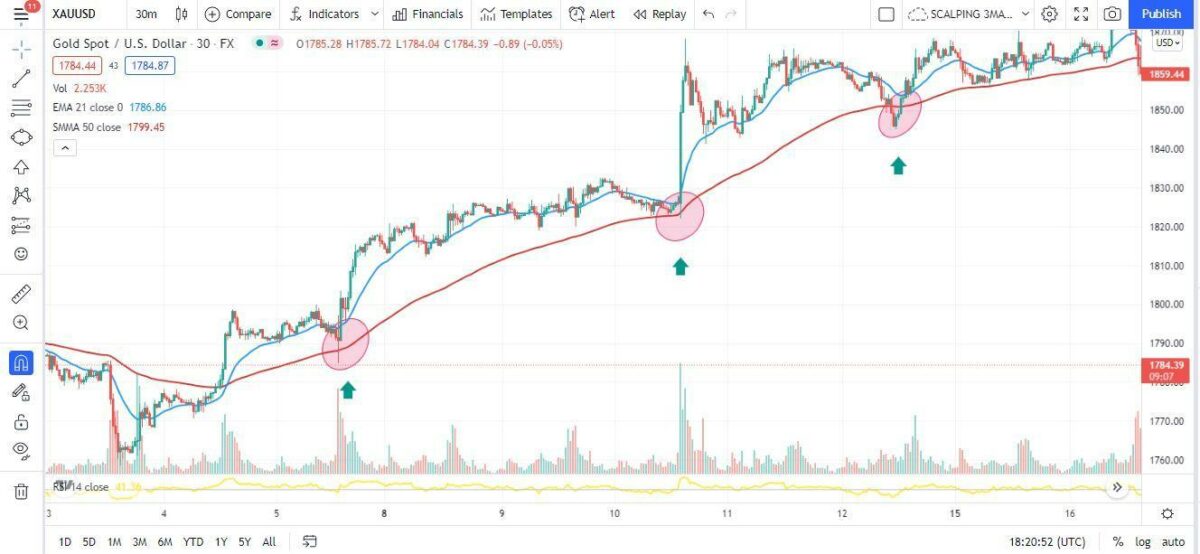
The above XAU/USD chart shows a bullish trade setup in a 30-minute time frame. We have applied a 21-period EMA and 50-period SMA on the chart to identify the ongoing trend or shifting of trend. This example shows a bullish trend shift at the bottom-left corner when the 21-EMA crosses the 50-SMA.
The SMA would work as price support in this strategy, whereas the EMA would indicate the potential trend reversal.
Entry
As we can see, the price repeatedly bounced from the 50-SMA support and resumed the upward trend. The potential entry points in this setup would be every time the price successfully retests the SMA.
Stop-loss
In the MAs crossover strategy, stop loss could be tightly placed, providing good risk-reward trade opportunities. In this case, we would put the stop loss just below the SMA.
Take profit
We would collect the profits at the first indication of price pullback. Generally, you could target 30-50 pips. On larger time frames, the take profit targets can exceed 200-300 pips.
Bearish trade setup
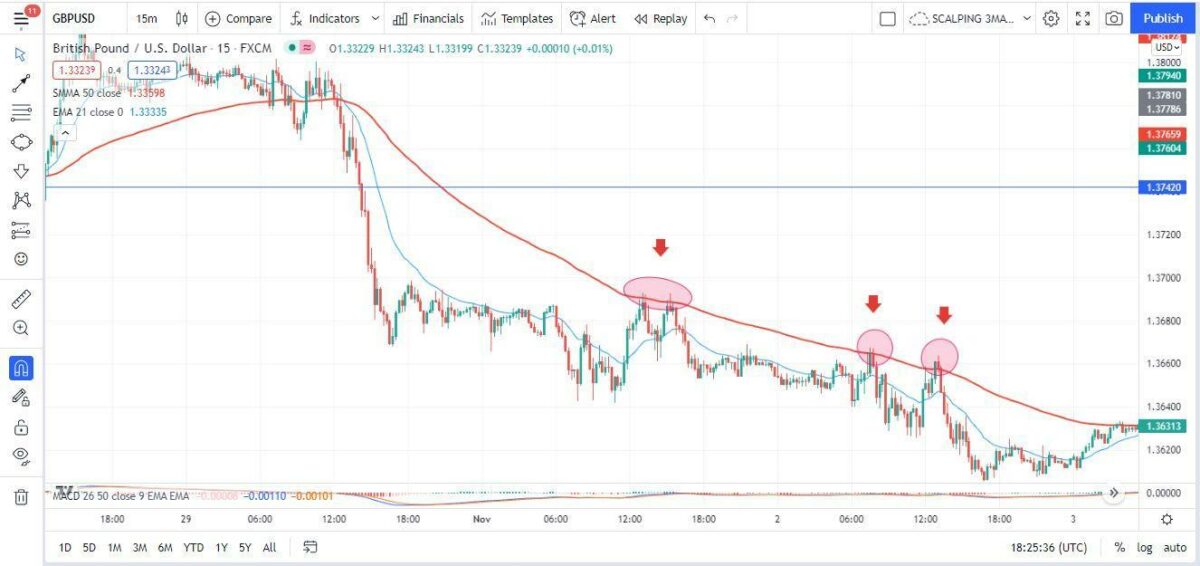
The above GBP/USD chart shows a bearish trade setup in a 15-minute time frame. Firstly, we would identify the existing trend by applying the 21-period EMA and 50-period SMA.
In this example, we could see the MAs cross over at the top-left corner, after which the price kept flowing below the MAs, pointing to a downward trend.
Entry
In the above case, the 50-SMA is acting as a price resistance. We would enter the trade when the price retests the SMA level.
Stop-loss
The stop loss could be tightly placed above the 50-SMA, leading to a reasonable risk-reward setup.
Take profit
We would take profit at the first signs of the next pullback. Usually, the TP range could be between 30 pips to 60 pips.
Which moving average is better for trading?
We cannot label one MA as better than the other, as their suitability varies with every traders’ trading style and approach. The primary difference between the two MAs is their reaction time to the price fluctuations.
The EMA swiftly reacts to the price variation and assists the traders in detecting changing trends timely. However, EMAs can provide false signals on the slight price bump.
On the other hand, traders who use an SMA can engage in steady trades with no interference from temporary market swings. But, at other times, SMA comes out late in pointing to a trend shift that could result in significant losses.
Generally, long-term traders prefer SMA as they display relatively stable price data. In contrast, short-term traders usually favor EMA as this dynamic average quickly notifies the shifting market conditions.
Pros and cons
| Worth to use | Worth to getaway |
| MAs provide a good idea about the potential support and resistance areas of price trends. | MAs become futile in ranging or indecisive market. |
| MAs continuously update and keep incorporating new price data. | MAs do not timely respond to any critical news or announcement that causes sudden price volatility. |
| Most traders utilize MAs as additional confirmation indicators with other advanced techniques. | Various MA cross-overs are momentary, which could be a fake trend-shifting signal to traders. |
Final thoughts
Moving averages are among the most common technical indicators that could provide straightforward and profitable trading setups. Moreover, some traders combine other advanced strategies with these dynamic averages to maximize their success chances.
Nonetheless, similar to all technical indicators, MAs are lagging and only represent previous price behavior. But a skillful and proficient trader can efficiently forecast future price direction through this simple indicator or by combining it with other tools.