Intraday traders are always keen to learn new strategies to enhance their skills and profit. Trading patterns are the most crucial aspect of trading that traders love and clearly count on when placing small and big trades. ABCD is the most straightforward harmonic trading pattern that has been forever.
The ABCD arrangement is simple and a great starting point for beginner traders. It’s one of the first patterns most traders learn to trade.
Three things to know before starting:
- ABCD pattern works best in combination with any existing strategy.
- It is a harmonic pattern that has four points and three legs.
- The arrangement works as both bullish and bearish reversal.
What is the ABCD pattern?
ABCD pattern is a frequently occurring pattern that can be seen in any trading chart, irrespective of the time frame. It is a part of a harmonic pattern. This pattern has two equal price swings called legs.
The ABCD pattern is formed by price forming three swing highs and lows, and the turning points of these swings are marked as A, B, C, and D. The three swings are known as ‘legs’ and are marked as AB, BC, and CD.
Why is it best for traders?
The ABCD pattern helps in giving traders a framework for risk and entry of their trades. This pattern enables traders to look into their risk before entering their trades. Moreover, this stops them from getting obliterated in the middle of a trend run because of a pullback.
The essential characteristic of the ABCD pattern is that it’s elementary to identify, even for a beginner trader.
Traders can use the ABCD pattern while trading any financial market like stocks, crypto, forex, etc. Also, traders can use it with any trading style. This formation gives a most elevated profitable trade entry.
The construction of the ABCD pattern?
ABCD is a reversal pattern that assists you in finding out when the market is on the verge of changing direction. The idea is straightforward like we do in any investing process, buy when prices are low and about to rise or sell when they are high and about to fall.
The pattern comprises of three legs, with two equal legs marked AB and CD; together, they form a zig-zag shape.
AB, BC, and CD three legs

The first leg AB
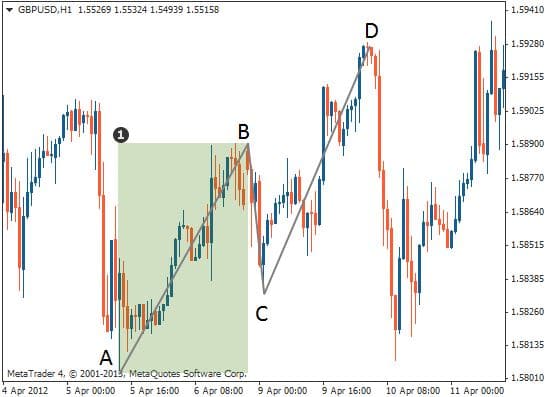
As shown below, while the market is heading upwards, the first leg (A-B) forms as the price rises from A to B.
BC Leg
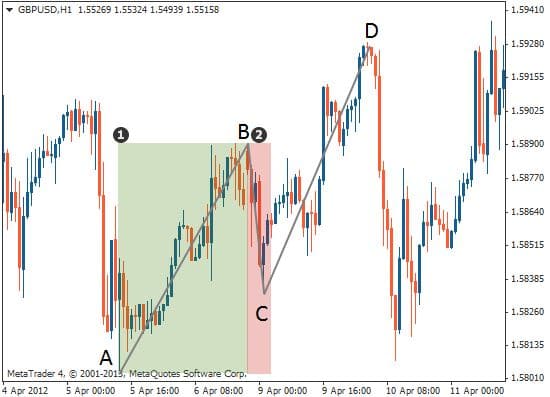
At point B, the price changes its direction and retraces down sharply to form the B-C leg.
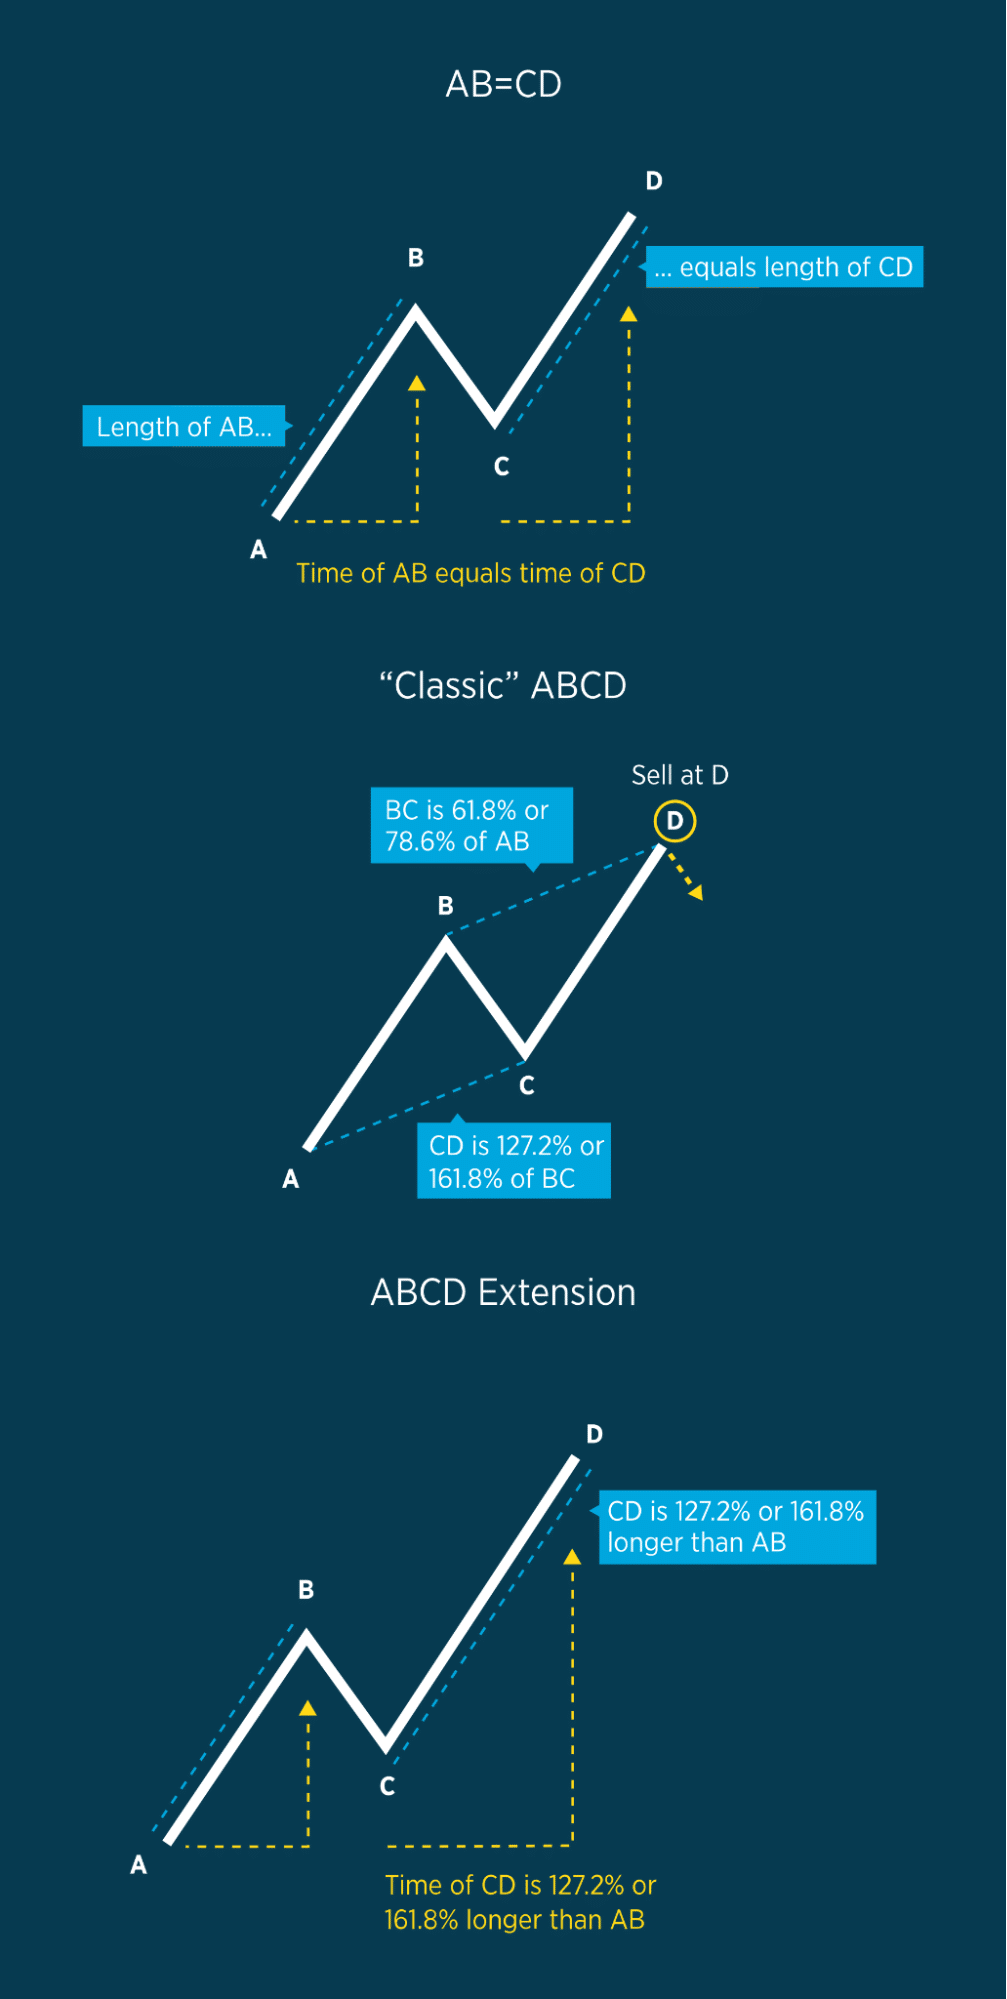
The retracement move from B to C can be anywhere between 38.2% to 78.6% of the A-B leg; however, an ideal pattern has retracement of 61.8% to 78.6%. We will use Fibonacci at this point later on.
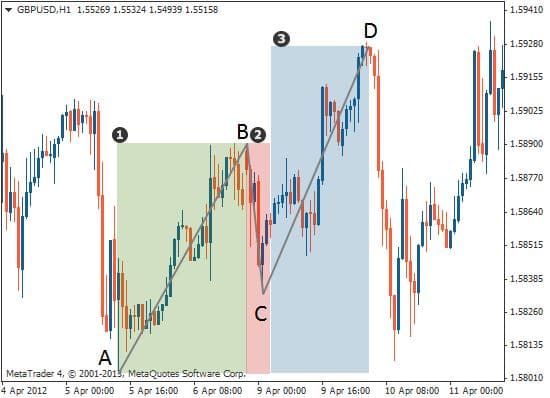
CD Leg
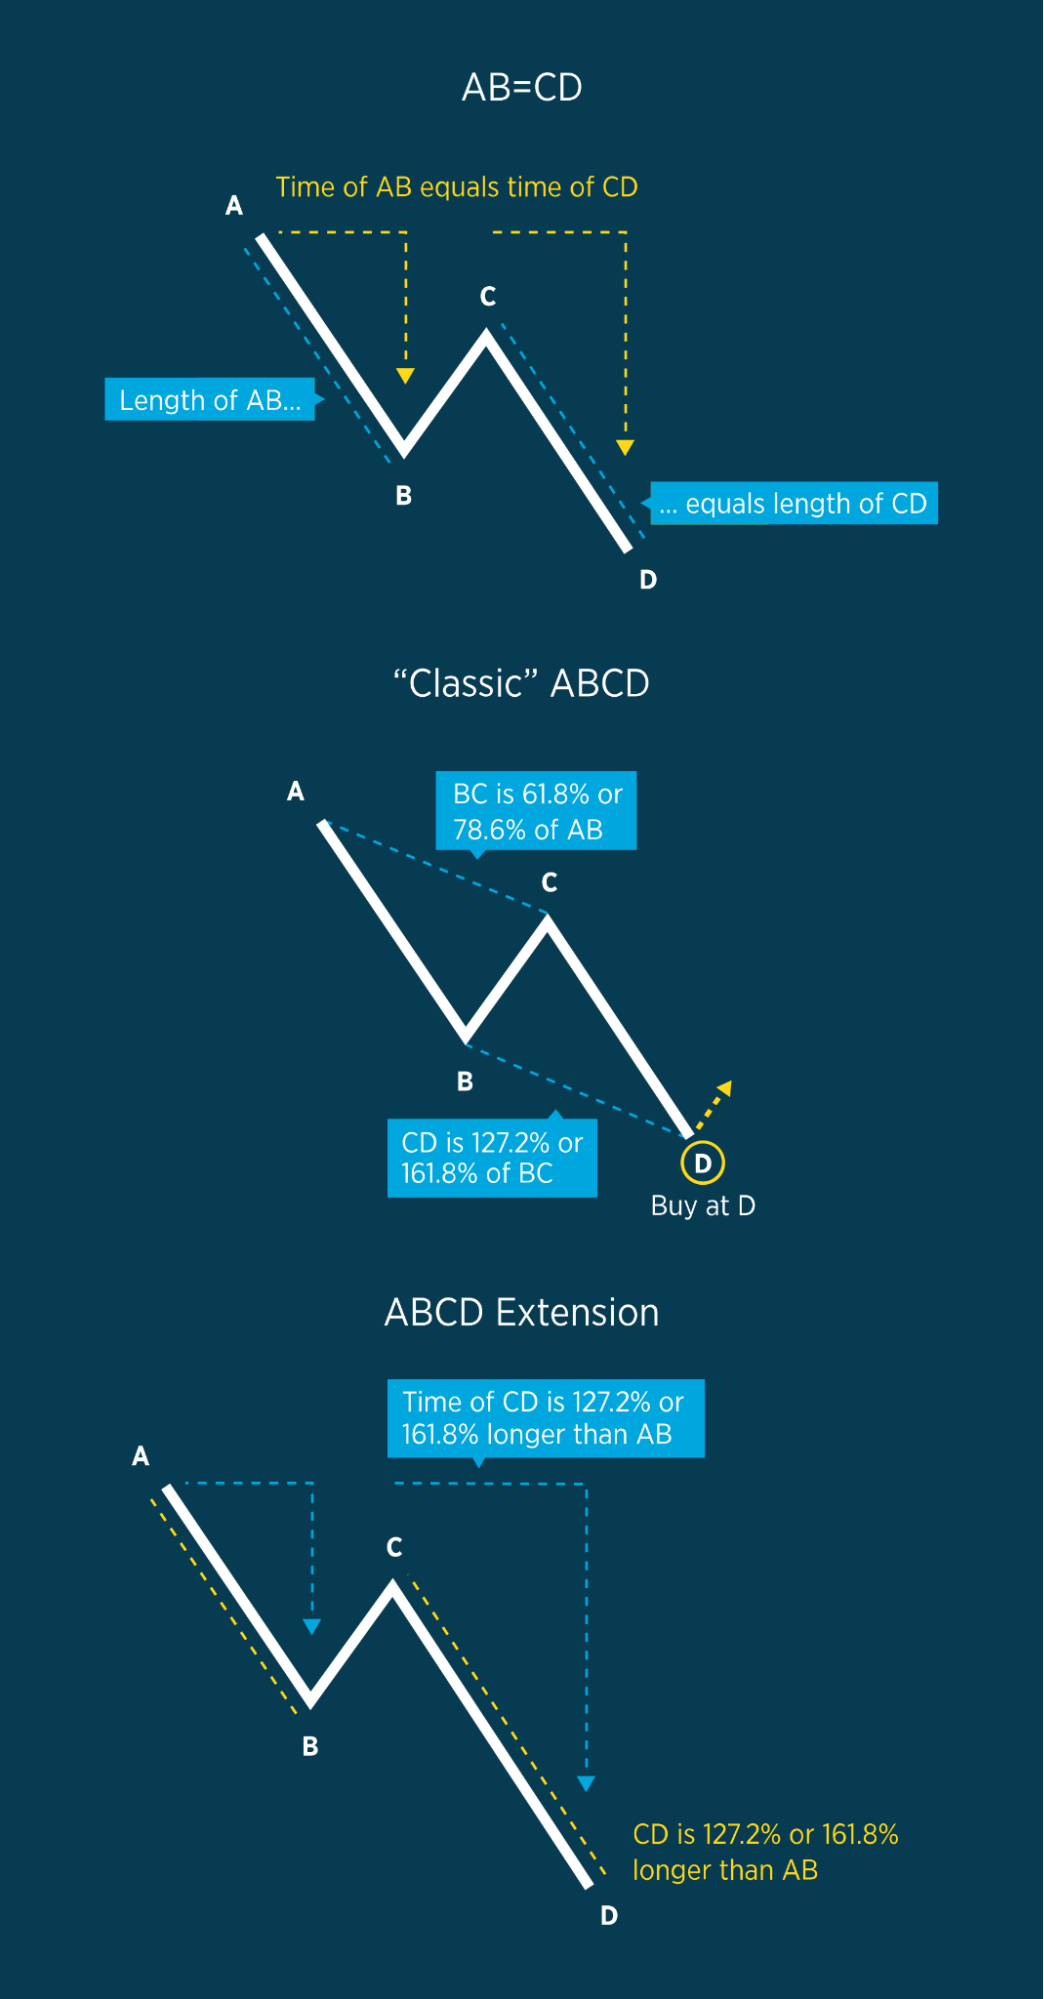
At point C, the price switches direction again and continues its original uptrend. This leg (C-D) slopes upwards, parallel with the A-B leg, and should ideally be the same length as the A-B leg when it completes. The ideal AB=CD pattern is equal in time and price, with point D being a Fibonacci extension between 127%-161.8% of the B-C leg.
How to use the ABCD pattern strategy?
The discussed formation can be both bullish and bearish. You can follow the steps mentioned below to begin trading with this strategy.
Bullish ABCD pattern rules
- Find AB
- Find point A which is a prominent high.
- Find point B, which is a recent swing low.
- The price must move in between the A and B high and low.
- If AB, then find BC
- Find point C, which is a new lower high. Keep in mind the point C must be lower than point A.
- Ideally the point C will be 61.8% or 78.6% of AB.
- If BC, then draw CD
- Point D must be lower than point B and also the lower low.
- Determine where D may complete, i.e., CD may equal AB in price.
- CD may be 127.2% or 161.8% of AB in price.
- CD may be 127.2% or 161.8% of BC in price.
- Traders must keep an eye on the price gaps and long candles that may occur in the CD leg while price farming the final D point. It is an interpretation of a potential strongly trendy market.
Bearish ABCD pattern rules
- Find AB
- Find point A which is a significant low.
- Find point B, which is a recent swing high.
- The price must move between the A and B, lows and highs.
- If AB, then find BC
- Find point C, which is a new higher low. Keep in mind the point C must be higher than point A.
- Ideally the point C will be 61.8% or 78.6% of AB.
- If BC, then draw CD
- Point D must be higher than point B and also the higher high.
- Determine where D may complete, i.e., CD may equal AB in price.
- CD maybe 127.2% or 161.8% of AB in price
- CD maybe 127.2% or 161.8% of BC in price
- Traders must keep an eye on the price gaps and long candles that may occur in the CD leg while price farming the final D point. It is an interpretation of a potential strongly trendy market.
Place your entry order
You will place your entry right after point D. look for some reversal candle that signifies the price will reverse.
Set your stop-loss
Place your stop loss 20-30 pips above or low the point D, depending upon the buy or sell trade.
Set your profit target
You can use a Fibonacci retracement to decide on the take profit. You can place your take-profit order at the 38.2%, 50.0%, and 61.8% levels. The best among the three is 61.8%. If you don’t use Fibo, you can look for the dynamic support or resistance for the TP zone.
Pros and cons
ABCD pattern, like all others, has some pros and cons. Look into a few of the most important ones before using the strategy.
| Worth to use | Worth to getaway |
| • ABCD pattern has an excellent winning ratio and gives a quality risk to reward. | • Patterns can be confusing for beginners. |
| • Can be used by beginners and advanced traders. | • It is hard to decide if the market will move in the opposite direction after forming the last leg. |
| • Works best in a volatile market. |
Final thoughts
ABCD is like any other trading pattern with the advantage of being used with any trading style and assets. It is always better to use the formation with indicators or price action for the best results.