Technical analysis is the most popular analytical strategy utilized by traders and investors to identify trading opportunities. The central component of technical analysis is technical indicators that evaluate the price action and present diverse trading scenarios to traders.
Richard Donchian, the father of trend following, developed one such indicator, The Donchian channel, during the 20th century. Most traders utilize this three-banded tool to trade potential trends, breakouts, and reversals.
So, do you want to understand the details and specifications of this technical indicator, popular for highlighting trends? Read this article to know its working approach and how you can apply various Donchian strategies to your trades.
Three things to know before starting:
- It is a trend-following indicator that points to the potential breakouts and new trends.
- Donchian bands form due to MA calculations and determine the bullish & bearish extremes during a given period.
- Traders can upgrade the quality of their trades by combining these channels with other indicators, e.g., momentum oscillators.
What are the Donchian Channel?
It is a simple trend-following oscillator pinpoints breakouts, reversals, and emerging trends. The indicator primarily drafts three lines, where the resistance line indicates the highest price and the support level marks the lowest price over a fixed period. The middle band refers to the average of upper and bottom lines.
Moreover, this indicator can work across various markets, including forex and stocks markets with significant liquidity. The default period of this tool is 20; however, you can change this period according to your strategy.
In addition, Donchian bands provide a visual presentation of the price range and volatility of the market. The channels become relatively more comprehensive during aggressive price fluctuations, whereas they shrink during low market volatility.
Understanding the Donchian trading strategy
Traders utilize Donchian channels in diverse ways to identify quality trades. Usually, these channels can give better results and specify high probability trades by correlating with other indicators.
It is important to note that these bands work contrary to the traditional strategy of trading the overbought/oversold areas. When the candlesticks keep touching the lower line, it is primarily an indication of a ‘strong down trend’ that would continue for some time. Going long on the lower Donchian support can get you on a losing spree.
Moreover, Donchian channels are different from the Bollinger bands as they only consider the ranging price data over a defined period. On the other hand, the Bollinger band forms by additional calculations and incorporates standard deviation data from the SMA.
Here, we have discussed several trading strategies with individual Donchian channels and their use in fusion with other indicators.
Donchian channel: ride the trend
You can easily use Donchian channels to go along the direction of the trend. After a consolidation area where the channels become flat, you can follow the emerging trend to grab the relevant trade opportunity.
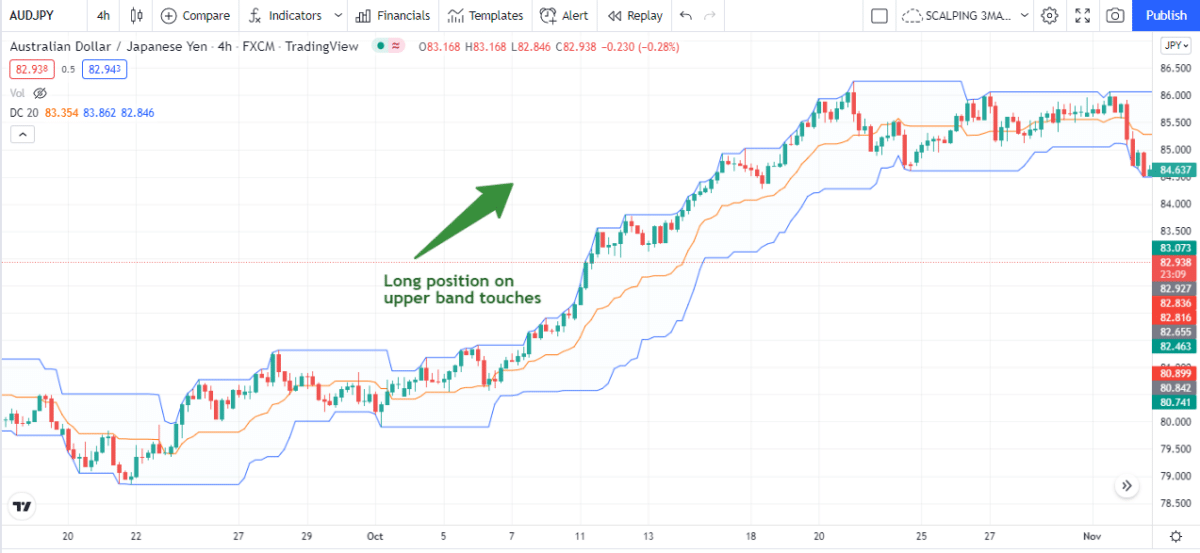
The above chart shows the price movement of the AUD/JPY pair in the 4-hour time frame. Here, we have applied Donchian bands on the default 20-period setting.
You can see that the consecutive bullish candles keep forming near the top line. The traders can enter a bullish position when the band establishes an upward direction and moves out of the flattening with the touch of each candle.
The take-profit targets can easily be at 1:2 or 1:3 RR. Traders can exit the trades on the spotting of the first big bear candle.
The stop-loss position can be just below the lower Donchian channel. However, a trailing stop loss can minimize the potential loss with the progressing trade.
Donchian channel breakout: upper or lower bands
Donchian strategy is most famous for trading breakouts. Traders enter in the breakout direction to capture the impending price move from the bottom/top.
A breakout signal appears when the candlestick breaches the upper or lower channel. However, the bands continuously rearrange, removing the line fissure. Therefore, it necessitates a timely detection of the opportunity, or you can miss the move.
In addition, most traders strive to enhance their winning probability by syncing their Donchian system trades with volume and momentum indicators like RSI or MACD. It is because a high momentum breakout marks the robustness and authenticity of the developing trend.
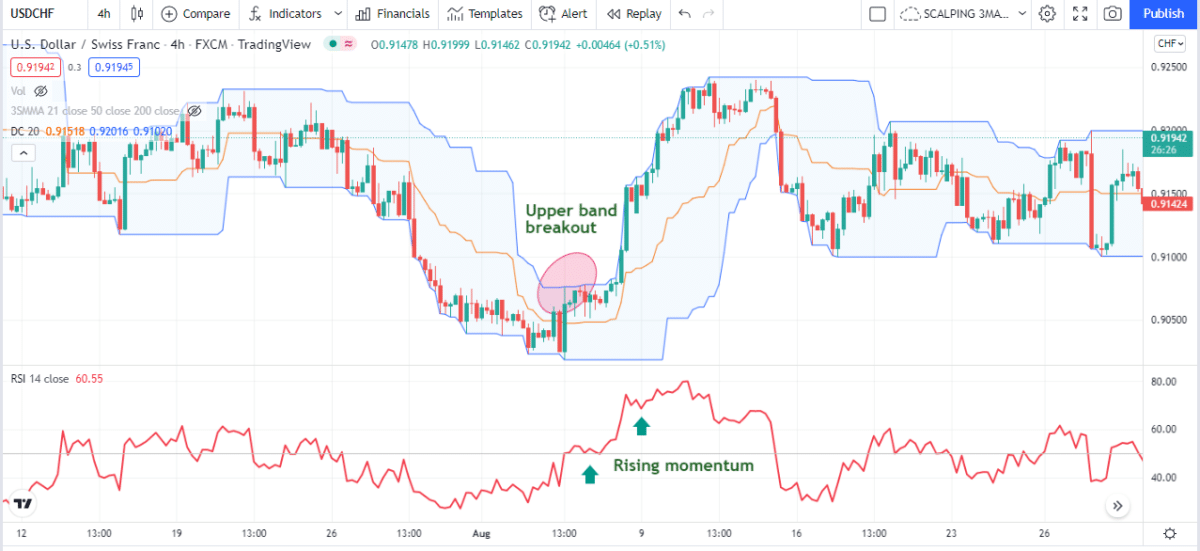
The above chart shows the price action of the USD/CHF pair in the 4-hour time frame. We have applied 20-period Donchian and RSI to this trading system.
There was a breakout of the upper band in the circled area; however, the channel quickly reprinted and removed the breakout visibility.
As you can see above, the RSI supported the validity of breakout by manifesting a rising momentum. Traders could go long on the breakout expecting the price to thrust in the bullish trajectory.
A trailing stop loss can help scale profits and minimize the losses.
Donchian middle band strategy
Due to their higher appearance frequency, some traders utilize the centerline breakouts for trades. These active traders buy when a candlestick crosses the middle line to move upside and sell when the price crosses the centerline to go downside.
Moreover, various traders take advantage of the middle-average line to add more positions to their ongoing, trending or breakout, trades.
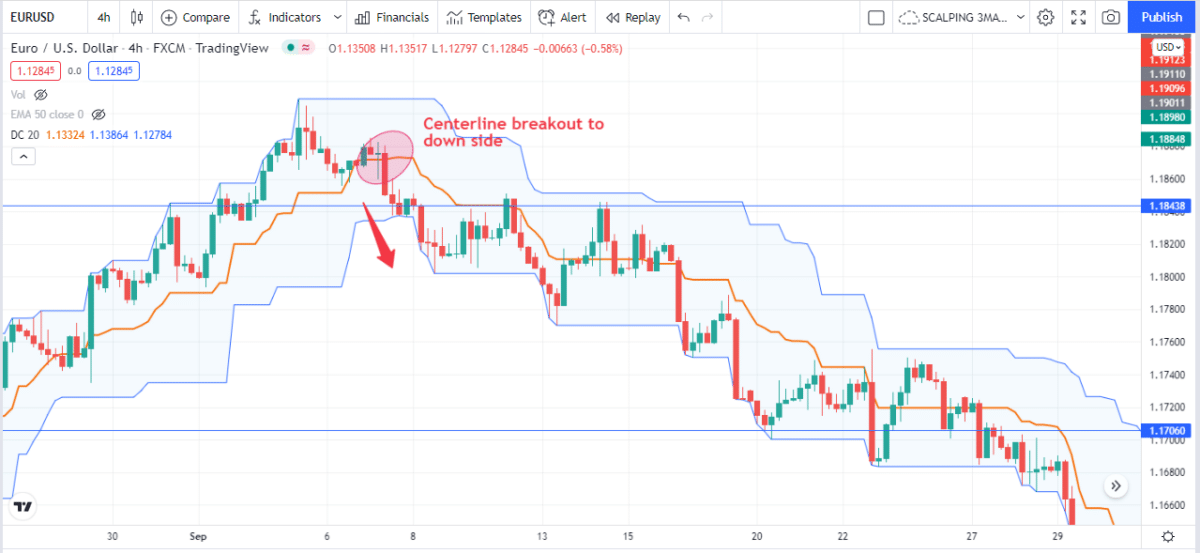
We have applied a Donchian channel on the above 4-hour EUR/USD chart. The graph shows a clean centerline-bearish breakout occurring earlier than the bottom line breach.
Aggressive traders can enter a short position here to catch the bigger part of the move.
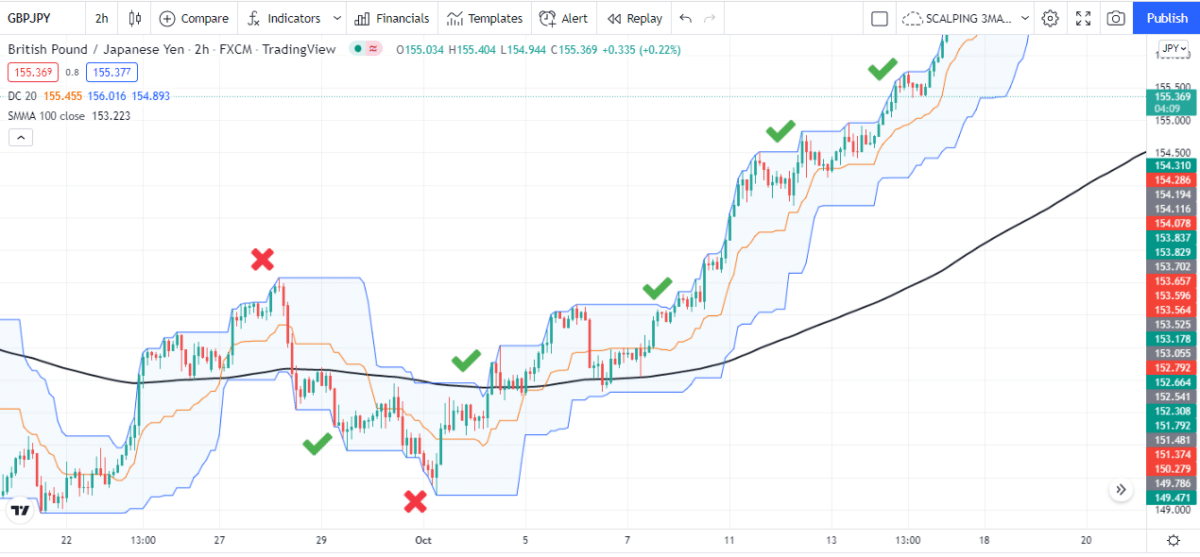
Donchian channel with moving average
Adding a large-period smoothed moving average to the Donchian system can filter out quality trades. Traders can enhance their winning rate by going long when the price is upside to the MA, whereas they can enter bearish trades when the price is below the MA.
We applied a 100-period moving average along with the Donchian channels on a 2-hour GBPJPY chart. There were only two false breakout signals utilizing this strategy as marked by red crosses in the following chart.
Pros and cons
We have listed some of the advantages and drawbacks of this strategy.
| Worth to use | Worth to getaway |
| Capitalize on the trend The channels provide high winning trades due to their movement along the trend direction and momentum of the market. | No use in a consolidated market Donchian channels become flattened and useless during the price consolidation phases. |
| Versatile indicator Donchian channels work well with all time frame charts and trading markets | Risk of false signals This oscillator can generate false signals as it forms according to the previous price data. |
| High reward trades Generally, the indicator identifies high reward trades around 1:3 RR. | Not consider fundamental factors There is always a risk of losing trades as this technical indicator does not consider any fundamental data. |
Final thoughts
Donchian channels indicator is a considerably practical and straightforward technical tool that provides a graphical demonstration of the price action. Many traders boost their trading effectiveness by integrating the Donchian bands with other indicators, such as moving averages or RSI.
However, no indicator can work with 100% accuracy; hence traders should adjust the Donchian settings according to their trading strategy and style to procure maximum profits.