When you embark on a trading journey, you might have the idea that all you need to do is find a good entry and trade the market.
The most valuable information any trader can have would be to predict the market’s next move. However, this is impossible as we cannot predict the future. But there are sure signs that we can study to identify the direction the price will likely take with a high degree of certainty.
Retail traders are not the market makers, meaning they don’t decide where the price will move. If you ever wondered what exactly drives the price movement, then you need to read this article.
Volume spread analysis (VSA) is an age-old technique that seasoned investors and traders use all the time. Let’s check how you can benefit from understanding this concept.
Three things to know before start:
- VSA is a trading form that also uses volume, which is an essential character of the market to take into consideration.
- The market phases give us an indication of the direction and when to open the positions for buying or selling.
- Volume helps you understand if the market is good enough for you to enter or not.
History of volume spread analysis (VSA)
The method of analyzing volumes and price movements has its roots at the beginning of the century, when there were no computers, and the primary information about trading was the opening, closing, minimum, maximum, and volume prices. One of the pioneers of this method was Richard D. Wyckoff.
As a broker, he was initiated into the behind-the-scenes games of large speculators and understood that “it is possible to assess the future course of the market by his actions, since the movement of the share price reflects the plans and goals of those who dominate the market, and the basic law of supply and demand governs all price changes.”
Wyckoff published his first method of technical analysis in 1908, and in 1911, began publishing weekly forecasts, using price and volume charts for research.
“Stock market technique is not an exact science,” Wyckoff said. In his opinion, a chart’s mechanical or purely mathematical analysis cannot compete with carefully considered judgment. Wyckoff also avoided financial statements, news reports, earnings reports, and especially rumors, clues, and “half-baked trading theories in popular market books.”
The method is based on the concept of accumulation and distribution. He described the entire cycle of a stock’s price movement from the lowest point, where prominent players accumulate, to the highest point, where shares are distributed to weak holders and back to the accumulation zone.
Followers of the Wyckoff method have contributed a lot to the VSA theory in classifying bars and patterns, highlighting two main categories — patterns of strength and patterns of weakness. One of the brightest representatives of the VSA theory today is Tom Williams.
Tom Williams classified bars and patterns, creating the basis for building indicators and trading strategies. Williams detailed some specific phases of the market that were overlooked or only briefly covered by Wyckoff.
What is smart money?

Before we understand what volume spread analysis is, let’s discuss smart money. This term comes from gamblers who have a deeper understanding and inside knowledge of a betting sport. This knowledge is usually inaccessible to the public.
Similarly, in the FX market, smart money determines how the market will move. As a new retail trader, you should note that we are not the only ones controlling the FX. The main drivers of this market are institutional investors like banks and hedge funds.
Smart money is, therefore, the driving force behind market movements. Retail traders take advantage of the movements and structure that the market makes. These institutions invest large sums of money. However, they play a small part, and their volume is insufficient to shift the price direction.
What is volume spread analysis (VSA)
The volume of the market is the number of lots traded within a particular time frame. The larger the volume, the more significant the price movement.
Volume is a crucial aspect when analyzing price movements and a component that many retail traders ignore. In addition to technical analysis, volume analysis can give you an added advantage.
The premise of volume spread analysis is that the market goes through cycles, and smart money determines these cycles. If we understand what the institutional investors are doing in the market, we gain a significant edge.
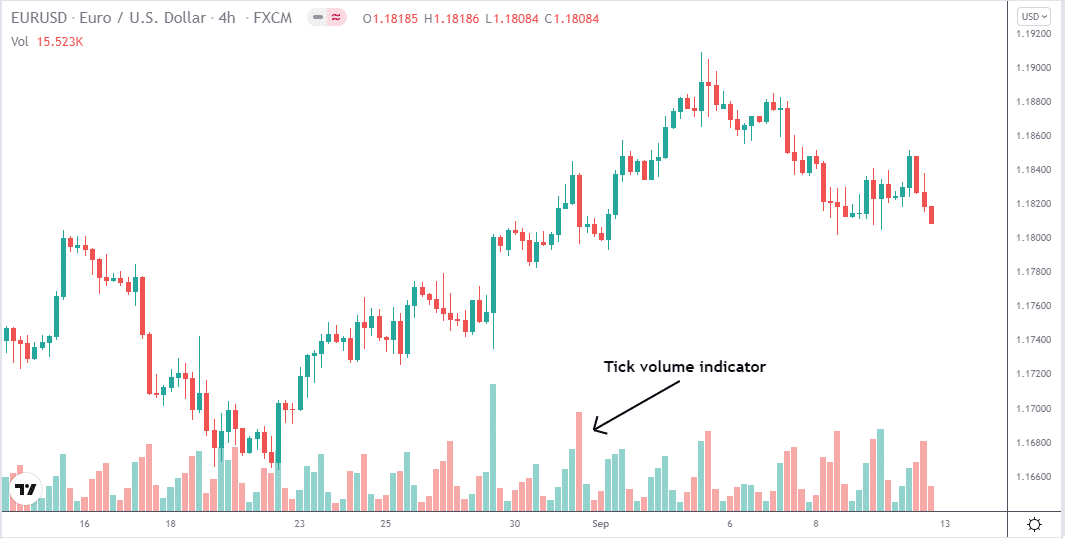
The chart shows the volume indicator, which presents the activity per candlestick. Volume indicates when the momentum is slowing down as well as how strong a trend is. Furthermore, changes in volume result in price changes.
An indicator of volume in the FX markets is tick volume charts. However, it does not represent total trade volume but rather the number of times a price moves up or down.
What is an analysis of volume differences?
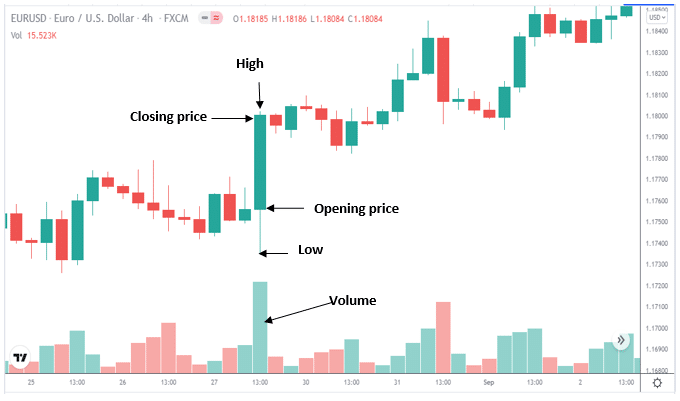
As we mentioned, smart money determines the market structure and price movement. The practice of volume spread analysis is to determine what the supply and demand differences are. There are three main variables that we can use to determine the supply and demand differences:
- The volume quantity for each candlestick
- The spread range between high and low
- The closing price
Furthermore, the market goes through four phases and knowing the variables mentioned above will help us determine these phases.
- Accumulation
When investors buy at wholesale prices
- Mark-up
When the market is going through a bullish trend
- Distribution
When institutional investors sell at retail prices
- Mark-down
When the market goes through a bearish trend
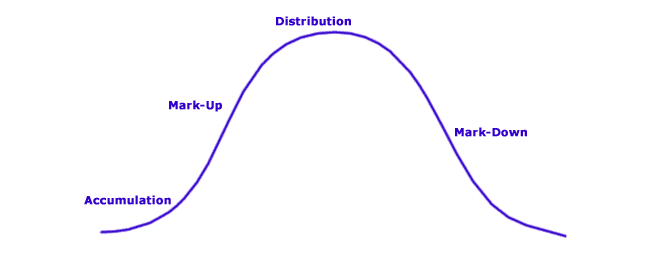
This diagram represents the different market phases.
The above chart shows the different phases of the market cycle. By understanding the stages of the market, it allows trading the direction with the smart money traders.
How to trade using volume spread analysis?
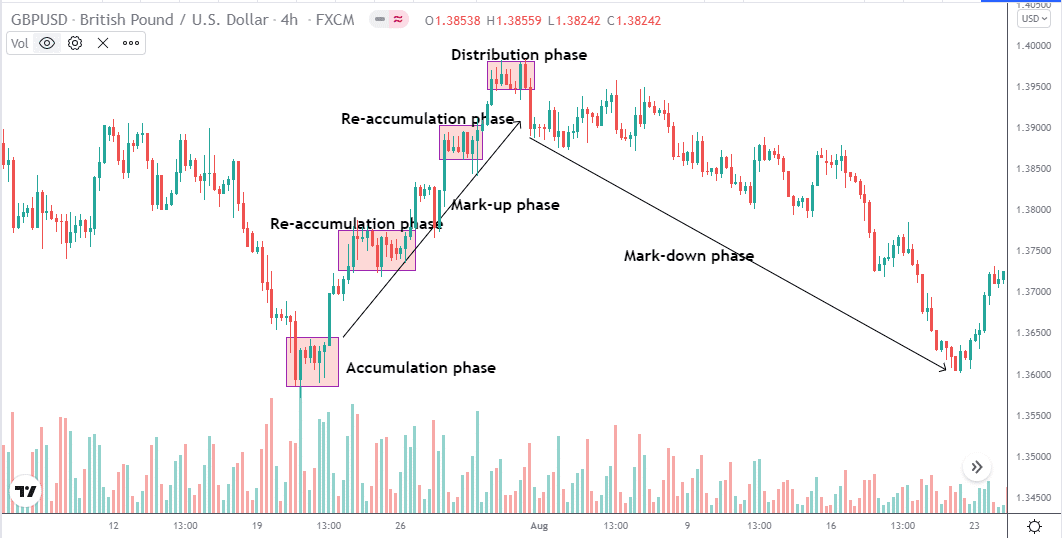
The chart below illustrates how combining market cycles with volume helps identify a good trading opportunity.
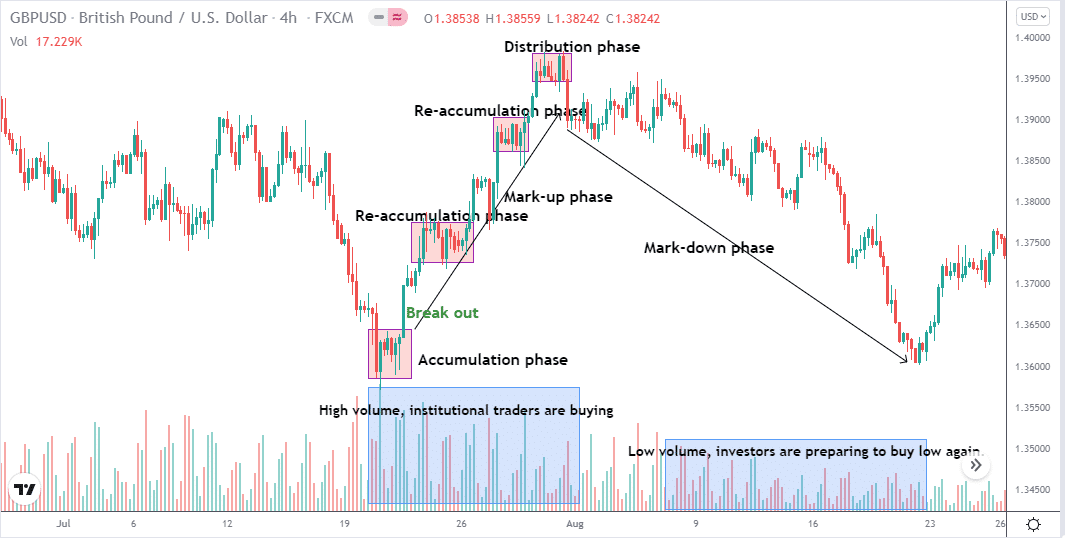
If we study the same chart and observe the volume, we notice that the volume is high during accumulation. This is where institutional investors buy at low prices. This is also an excellent place to apply technical knowledge and spot a breakout to trade the trend upwards.
The higher volume continues during the mark-up phase, which is bullish, showing that smart money is in control.
During the distribution phase, the market stays in a range that can last for days. This phase is a sign of price reversal. The double top and head and shoulders pattern is an indication of price reversals.
The mark-down phase is when investors are getting ready to buy again; as we can see, the trend is down, and the volume is significantly low.
Pros & cons of volume spread analysis
This method is a great way to boost your trading winning ratio if followed and done correctly, but it has some cons that you must consider looking into.
| Pros | Cons |
| •Hold during mark-up phase You can take advantage of trading the trend during the mark-up phase in which large investors dominate. | • Large volume equals high risk Volume is a good thing; however, it results in higher volatility which can be detrimental to a beginner trader with a small account. We need to keep in mind that the market makers invest billions in FX. |
| • The unique edge above the rest Understanding the market phases gives you a unique advantage over other retail traders since you trade with large banks and hedge funds. | • Scalpers will not benefit Scalpers will find it challenging to profit from volume spread analysis since they trade on smaller time frames and quickly enter and exit the market. |
| • Excellent swing trading opportunities Volume spread analysis works well for swing traders since you hold your trade for a longer duration. | • The method is not well suited for high-frequency trading In short time frames, technical analysis rules and supply and demand work weakly there. |
Final thoughts
Volume spread analysis is an excellent strategy to follow and one of the most important things a new trader should learn. Once you understand the underlying movements of the market, you will increase your success rate tremendously.
But risks are unavoidable since these investors trade huge lot sizes, which creates a high level of volatility. Therefore, paying attention to risk management is a vital component. We can only be grateful to the likes of Richard D. Wyckoff, who shared valuable experience and information of the markets to enable retail traders to take advantage of volume spread analysis.