Out of so many indicators, you might also have heard about momentum indicators. In foreign exchange trading, these indicators are used by anyone who wishes to trade, invest or even speculate in the market.
The primary interest while using these indicators lies in market intensity and trend analysis. Using Momentum indicators gives you the edge you lack as a price action trader or even trades using supply and demand zones.
As a forex trader, do you also want to read the charts using momentum indicators?
Please read further to learn all about momentum trading and the most reliable way to use it to your benefit.
Three things to know before start:
- In forex, technical analysis has many facets, and investors and traders use momentum trading to ascertain an asset’s strength in the upward and downwards direction.
- Taking uptrend and downtrend is good but not a consolidation market.
- You can use indicators, but you have to practice and know which performs well in a particular situation and market environment.
Understanding technical momentum indicator
Catching a trade can be done by applying various strategies, and using indicators is one of them. Most beginner traders often rely on indicators to generate profits from the market.
The use of indicators in forex is already massive but let’s first understand momentum before learning about the momentum indicator.
In simpler terms, momentum in FX trading is the terminology used to indicate the price movement speed in the market. At the same time, momentum trading is a strategy of buying an asset when the price surges and selling it once it is at its peak and about to fall.
On the other hand, a momentum indicator is a trading tool used to analyze the market speed and fluctuations and capture the trade setup.
We cannot assure you who did the first momentum investing, but yes, a well-known fund manager and investor Richard Driehaus took the practice and made it into the strategy he used to run his funds. He has his philosophy that investors can make great money from buying high and selling higher.
Why is it best for traders?
It is essential for traders, especially beginners, as it helps them know and grasp the speed at which the asset’s price varies.
Furthermore, you will know volume and volatility since both are aspects of momentum. The momentum indicator works well when the price is trending and not in a consolidation state.
Calculating the momentum indicator
The calculation for the technical momentum indicator is quite easy. You may follow the below steps.
First, you will need to divide the current closing price of the asset by the price of a previous period. Once done, multiply the quotient by 100. So, the formula for calculating the momentum will be as follow:
MOM = (current closing price ÷ closing price of a previous period) x 100
Top three momentum indicators

The two primary ways you can use the momentum indicators are by divergence and crossover techniques. Furthermore, numerous momentum indicators exist. However, only a few are commonly used.
- RSI
- MACD
- ADX
What is the Relative strength index?
The FX market is vast and potential, so it is desirable among all the traders globally.
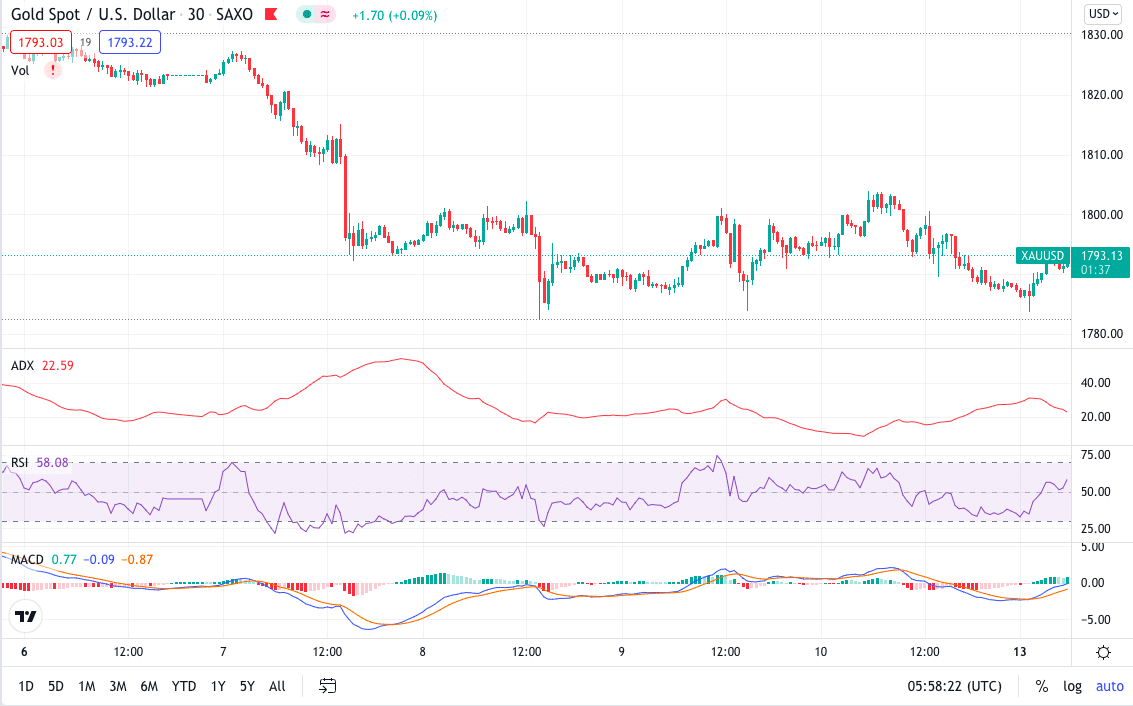
Among the most common, famous, and primarily used indicators is the RSI. Constructed by J. Welles Wilder, this momentum oscillator runs in the range zero to 100 and gauges the rate and fluctuations of price movements of an instrument.
The RSI line that swings back and forth between the zone helps the traders to identify the buyers’ or sellers’ sentiments in the market.
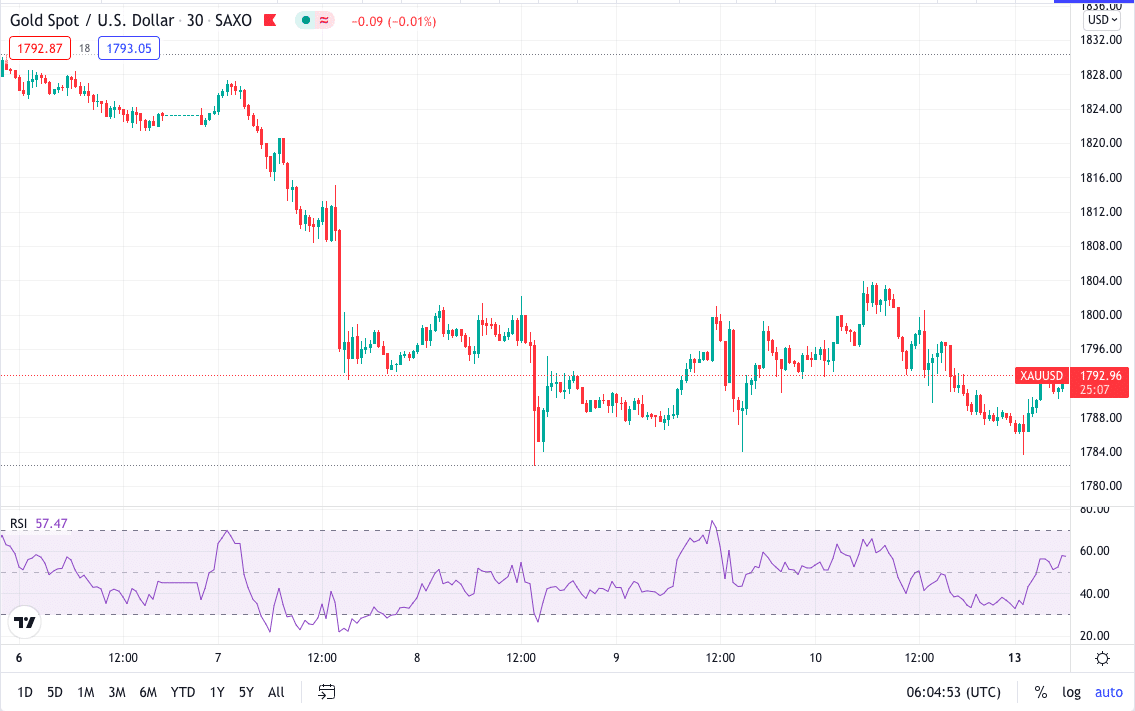
When the RSI reaches the 30-zone price is in the oversold zone, and when it comes to the 70 zones, the price is the overbought zone.
How to use RSI to measure momentum?
Many traders typically apply the RSI to look for overbought and oversold signals, but the way to read the charts using the RSI to spot divergence.
Divergence happens when the market price makes highs or lows, but the lines on the RSI show the opposite.
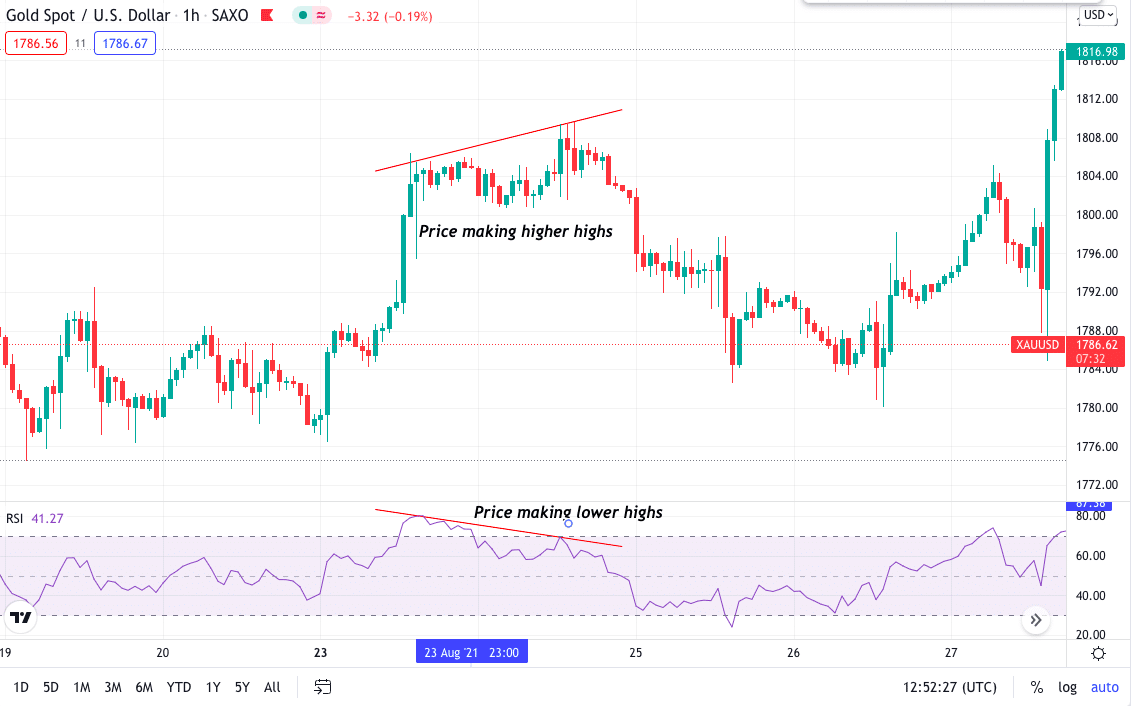
Looking at the chart below of the XAUUSD 1hr time frame, you can understand what divergence is. Here the price in the chart was forming higher highs while on the RSI, the line made a high and then a lower high. This is a signal of a possible brief change in price direction.
What is MACD?
The MACD indicator is a momentum oscillator fundamentally used by traders to trade trends. Two lines without limits represent the MACD, and when the lines cross, it signals a trading opportunity.
How to use MACD to measure momentum?
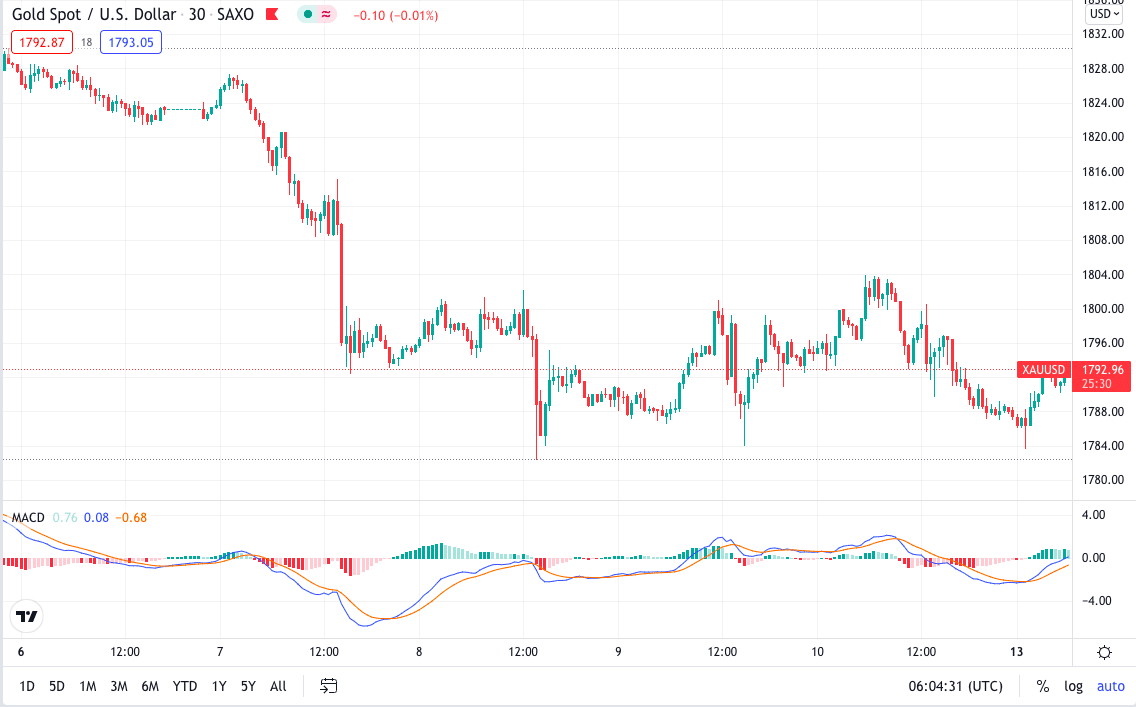
The MACD indicator consists of two exponential moving averages of periods 12 and 26. This indicator has two lines known as the MACD line. The MACD line is the difference between the 12 and 26 EMA and a signal line of 9 EMA.
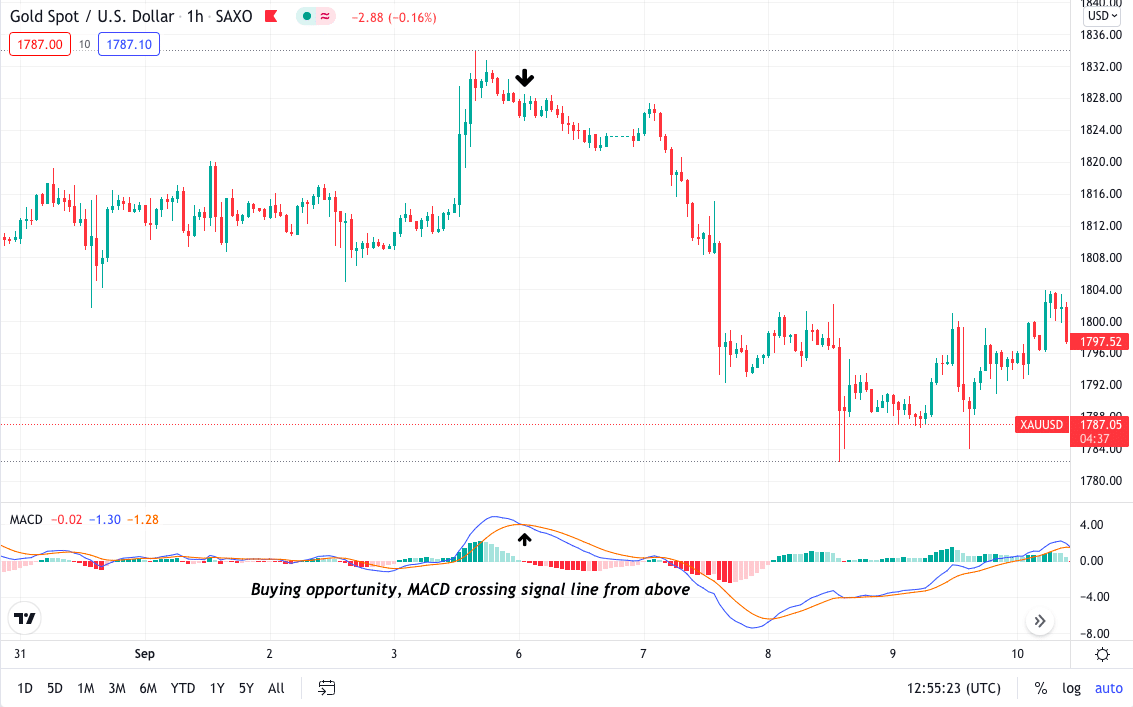
When the MACD line and the signal line cross moving from up going down, it shows a possible selling signal, while if the MACD line crosses the signal lines moving from down going up, it is a potential opportunity to buy.
In the below XAU/USD chart of 1hr, you can see the MACD indicator giving a sell signal when the blue MACD line crosses the signal line moving down.
What is the Average directional index?
Lastly is the ADX indicator that traders use as a temporary technical gauge to decide the market strength. Market strength is an essential aspect to keep in mind before entering the market. ADX helps to discover the trend strength.
How to use the ADX to gauge momentum?
The Directional movement system incorporates the ADX to evaluate the momentum and direction of price movements:
- Minus directional indicator (-DI)
- Plus directional indicator (+DI)
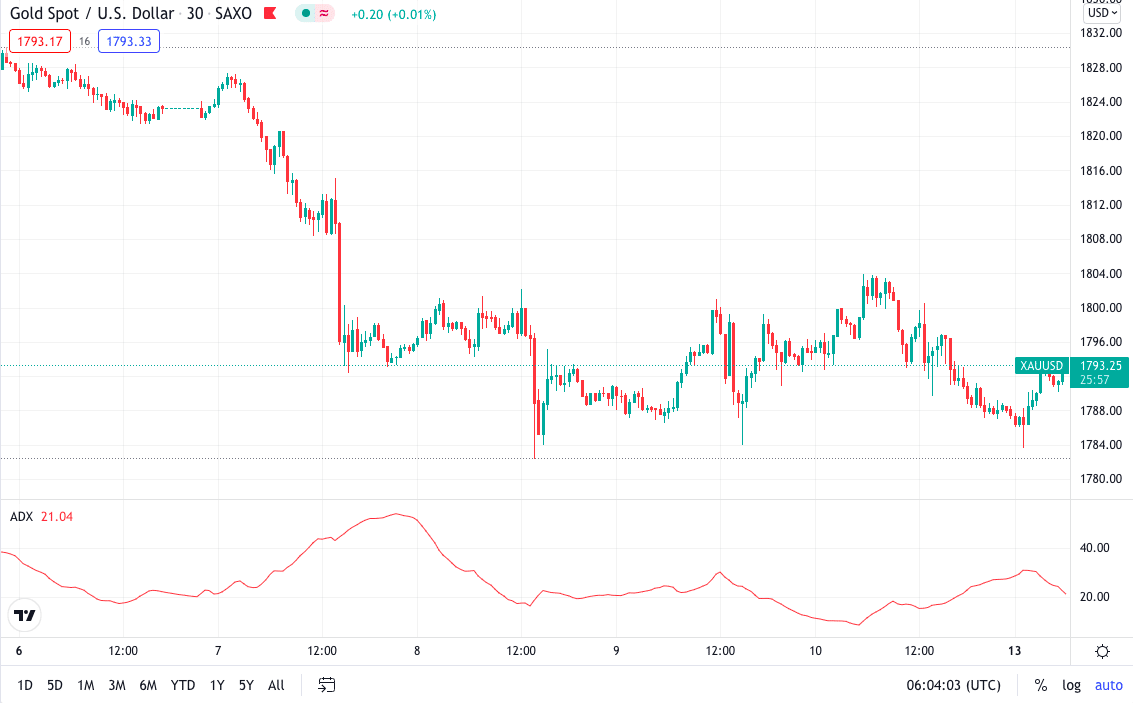
In the below XAU/USD 1hr chart, you can see the market is trending.
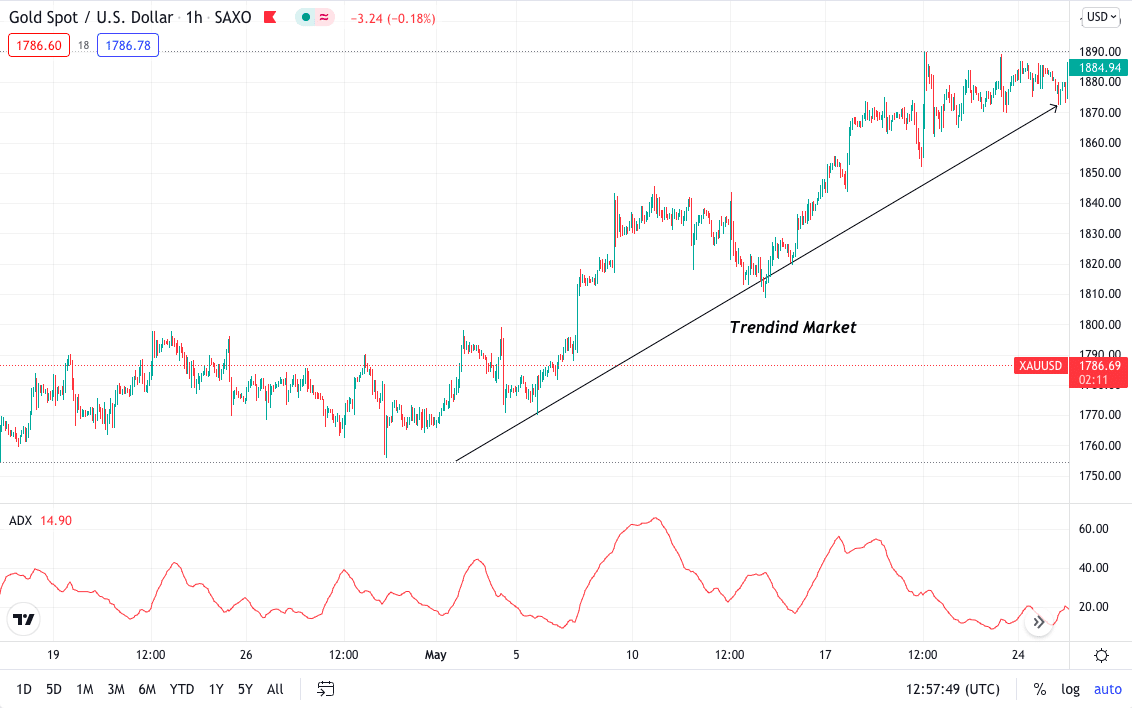
If the value of ADX is 20 or higher, it shows that the market is trending-either moving bullish or bearish, and for any reading less than 20, the market is viewed as a range or sideways movement.
Pros and cons
Everything seems great until you know everything has both its’s advantages and disadvantages. Let’s look into it to understand if the tools will add value to your trading.
| Worth to use | Worth to getaway |
| •Excellent for market strength Indicators help in giving high probability trades by giving you market strength. | •Not always right Not all the signals given by momentum indirections are right, for example, overbought and oversold. |
| •Providing signals Identifying the divergence can be a trading signal for a good trade setup. | •Inconsistency Price changes are usually variable and thus unpredictable. |
| •Future price predictions You can profit better from the trade setup if you add some other indicator and confluence. | •Not suitable for ranging markets Indicators do not work fine when the price consolidates or moves sideways. |
Final thoughts
Understanding the market momentum is crucial, and you can do a lot if you know what the market is trying to show you and where the market can go in the future.
A market with less volatility will lead to more trading costs, while a market with high volatility will have fewer trading costs. Knowing the market strength will be easy for you to figure out if your analysis will play outright or not.