Trading indicators are an unavoidable part of the financial market. Technical indicators are invincible, which are valuable to generate trade ideas by prioritizing the essential factors of the trading instruments, such as volatility, momentums, trends, price actions, etc.
The Chaikin Money Flow indicator is a unique tool that every forex trader should know.
However, mastering any indicator involves knowing the functionality and professional participants’ actions in different phases. The following section will discuss the Chaikin Flow Indicator, trade using it, and trading strategies with chart attachments.
What is the Chaikin Money Flow indicator?
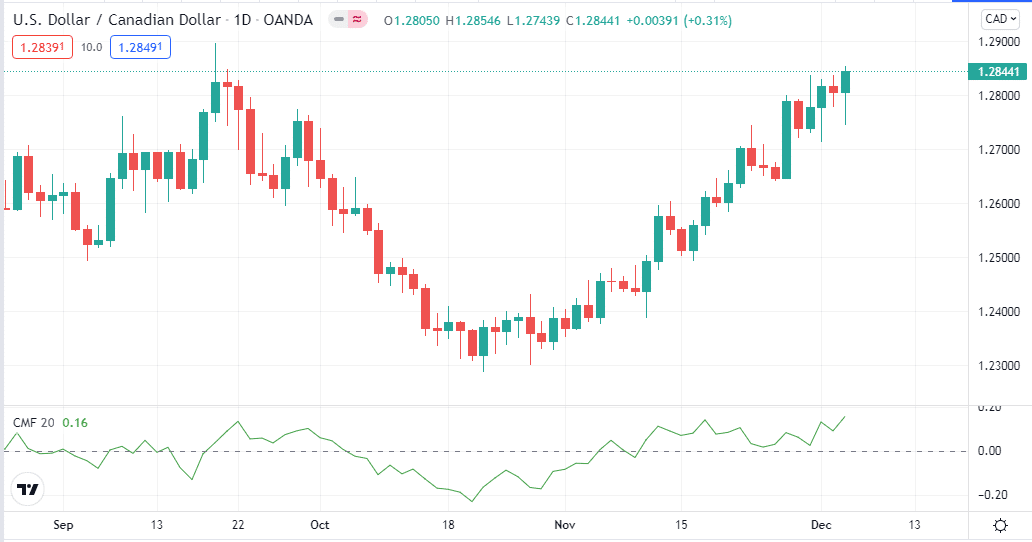
It is a technical indicator that estimates money flow volume during any specific period. The developing year of this indicator was in the 1980s by Marc Chaikin. This unique indicator determines the buying and selling pressure on financial instruments.
The most popular setting for this indicator is between 20 and 21. This indicator shows reading on an independent window that contains a dynamic line that frequently crosses above or below a central (0.0) line.
Meanwhile, the calculation of this indicator executes by following three steps:
- Money flow multiplier calculating equation is
Money flow multiplier = [(close price – low price) – (high price – close price)] / (high – low)
- Money flow volume equation is
Money flow volume = money flow multiplier x volume for the period
- Specific period defined by equation
20-period CMF = 20-period sum of money flow volume / 20-period sum of the volume
How to trade using the Chaikin Money flow indicator
When you want to use this indicator to execute successful trades, it requires knowing the primary features.
The primary features are:
- This indicator signals strength on the asset price when the CMF value is above the central (0.0) line. Meanwhile, it declares weakness when this value drops below the midline.
- This indicator generates a buy signal when the dynamic line creates lower lows on the oversold zone below the zero line. A diverging higher low indicates increasing buy pressure on the asset price.
- The CMF indicator signals a sell signal when the dynamic line creates higher highs on the overbought zone above the zero line. A diverging lower high indicates increasing sell pressure on the asset price.
- It is better to wait till breakout occurs on this indicator before opening any position. For example, suppose the price may break above any short-term resistance and wait till the dynamic line of the CMF window breaks above the zero line before opening a buy position.
Using these features, you can trade any trading asset with the help of this CMF indicator. You can combine many other technical indicator info with this indicator to catch the most accurate trading entry/exit positions.
A short-term trading strategy
We use the parabolic SAR, a technical indicator that identifies the trend shifting points, and the CMF indicator in this short-term trading method. This trading technique applies to any trading instrument on any timeframe chart. We recommend using charts between one min to hourly to generate short-term or day trading ideas. A 15-min chart is preferable to catch potential short-term entry-exit points.
Bullish trade scenario
Implement those indicators and seek opening buy positions when:
- The CMF value rises above the zero line and sloping more upside.
- The Parabolic dot takes place below price candles.
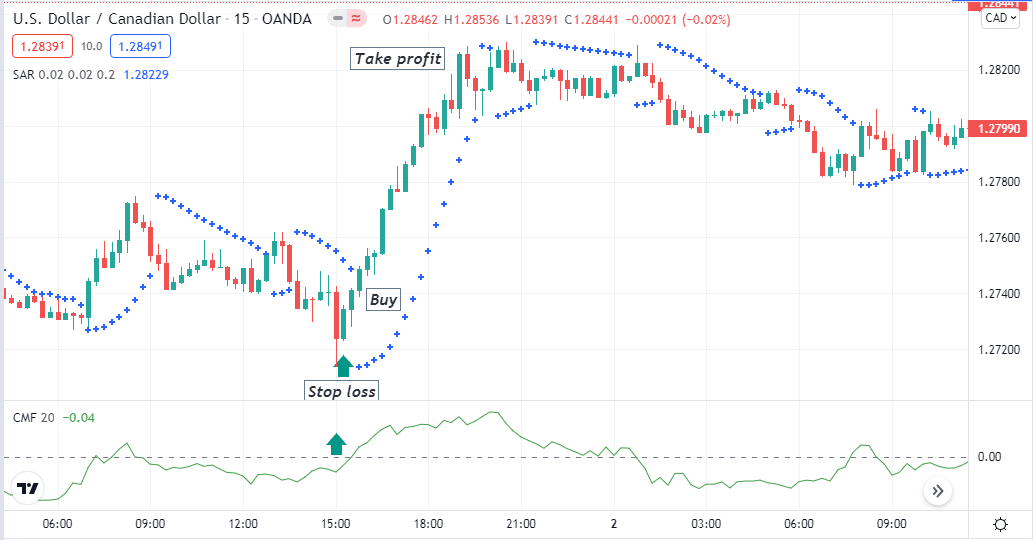
Entry
Open a buy position when these conditions above match your target asset chart.
Stop loss
The initial SL will be below the current swing low of your executing buy order.
Take profit
Close your buy position when:
- The parabolic SAR dot shifts position on the upside of price candles.
- The CMF value drops below the zero line.
Bearish trade scenario
Implement those indicators and seek opening sell positions when:
- The CMF value declines below the zero line and sloping more downside.
- The Parabolic dot takes place above price candles.
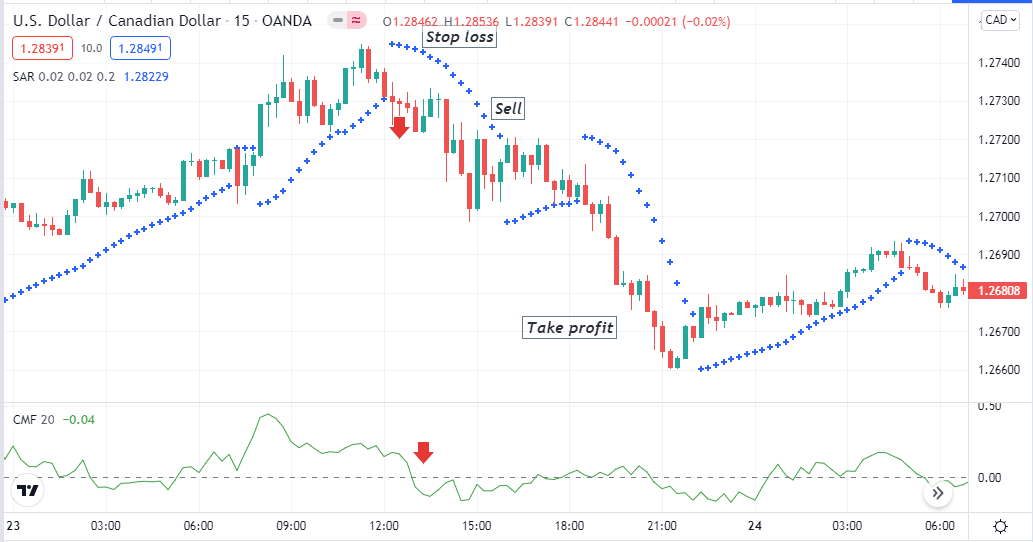
Entry
Open a sell position when these conditions above match your target asset chart.
Stop loss
The initial SL will be above the current swing high of your executing sell order.
Take profit
Close your sell position when:
- The parabolic SAR dot shifts position on the downside of price candles.
- The CMF value rises above the zero line.
A long-term trading strategy
We use the MACD indicator beside the CMF indicator in our long-term trading method. You can apply this method at time frame charts between hourly to daily on any trading instrument. An H4 or daily chart is preferable to get suitable long-term entry-exit positions that you can hold for days, even weeks.
Bullish trade scenario
Apply those indicators on your target asset chart and observe when:
- The dynamic blue line crosses the dynamic red line on the upside at the MACD window.
- MACD green histogram bars take place above the central line.
- The CMF value is over the zero line and sloping upside.
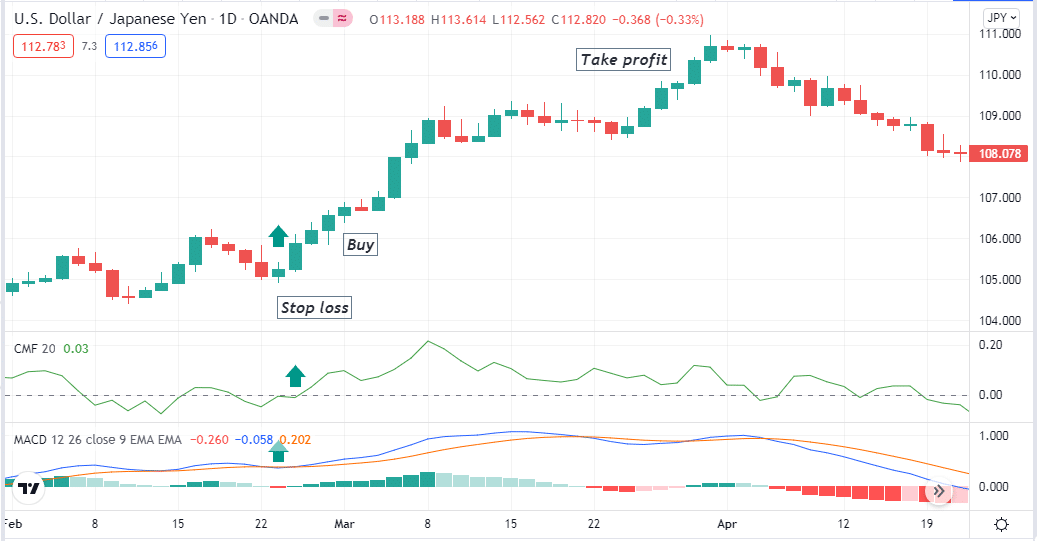
Entry
Match these conditions above with your target asset chart and place a buy order.
Stop loss
Your buy order’s initial stop loss level will be below the current swing low.
Take profit
Close the buy position when:
- The dynamic blue line crosses the dynamic red line on the downside of the MACD window.
- MACD red histogram bars take place below the central line.
- The CMF value drops below the zero line.
Bearish trade scenario
Apply those indicators on your target asset chart and observe when:
- The dynamic blue line crosses the dynamic red line on the downside at the MACD window.
- MACD red histogram bars take place below the central line.
- The CMF value is below the zero line and sloping downside.
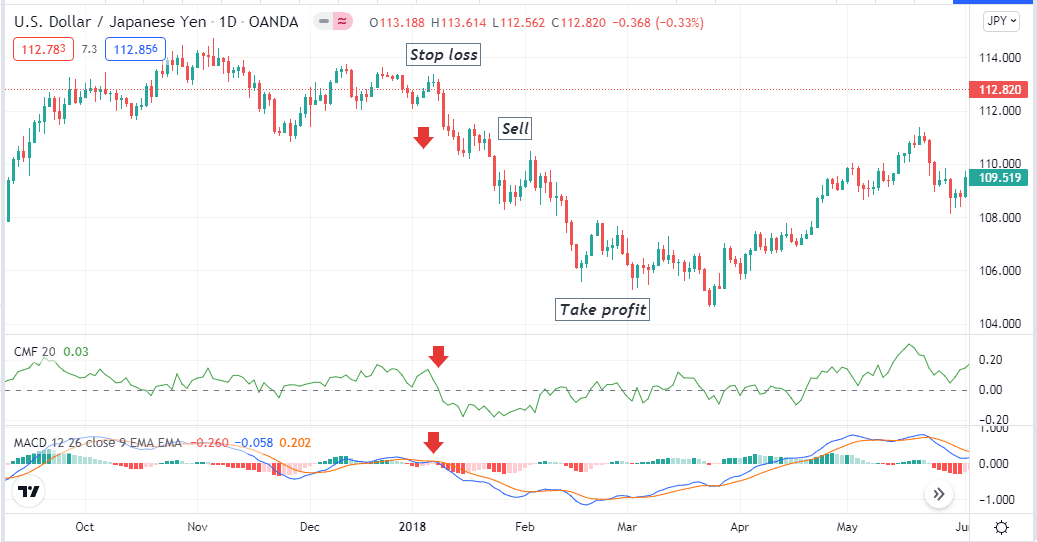
Entry
Match these conditions above with your target asset chart and place a sell order.
Stop loss
Your sell order’s initial SL level will be above the current swing high.
Take profit
Close the sell position when:
- The dynamic blue line crosses the dynamic red line on the upside of the MACD window.
- MACD green histogram bars take place above the central line.
- The CMF value rises above the zero line.
Pros and cons
| Worth to use | Worth to getaway |
| •Allow executing trades supporting price action methods. | •This indicator generates poor results when you use it as a stand-alone indicator. |
| •This indicator suits many trading instruments. | •Determining SL and profit-taking points through this indicator is not possible. |
| •Allow making both short-term and long-term trading positions. | •The CMF indicator can generate false signals on a consolidating phase by frequently fluctuating above or below zero. |
Final thought
Finally, the indicator is a potential tool that allows making positions by following accumulation and distribution phases of the asset price movement. Using this indicator in short-term time frames can be confusing to generate the best results.