Trading patterns work as a tool for future price prediction for technical traders. Whether it is forex or stocks, the formation of chart patterns is crucial to let traders know that the market could perform some actions that would be beneficial for them. Triangle patterns can occur much frequently on the charts.
In a volatile market, after a Triangle patterns is played out successfully, traders can see a movement of at least 50-70 pips, making them make good money.
Market participants can use these patterns in FX and any other market reasonably. As these patterns work most of the time and are accurate when traded correctly, you must learn them.
Read this article and acquire the required knowledge about successfully trading.
Three things about the Triangle pattern to know before starting:
- It is widely popular as it is easy to find, study, and make use of.
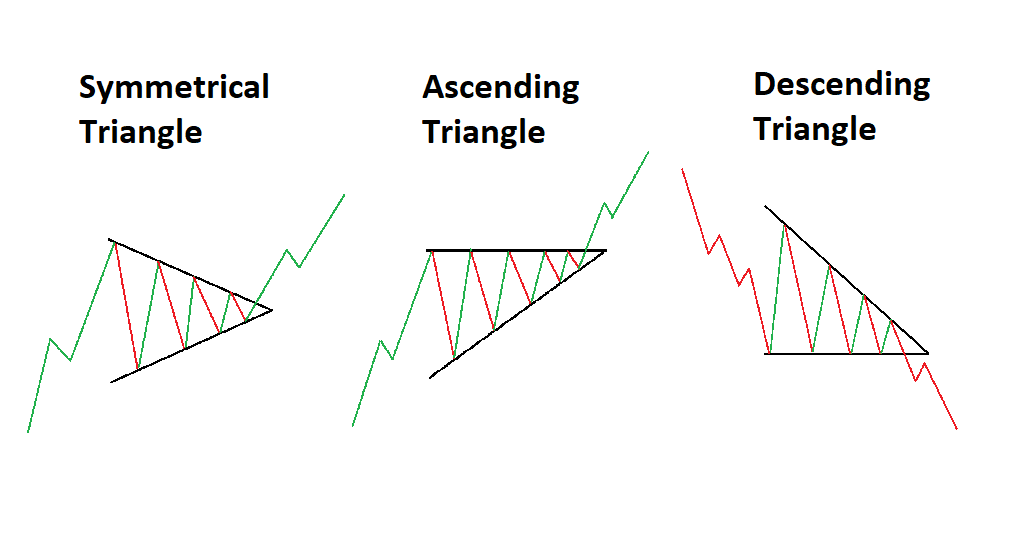
- There are three types of these patterns: Symmetric, Ascending, and Descending.
- It is mostly a “continuation pattern,” meaning the price after the breakout would follow the same market movement as before.
What is a Triangle pattern?
As the name indicates, it formes on trading charts with a shape and structure like a triangle. These patterns are made by price movements and used by technical traders after identifying them.
The triangle shape is given with the help of two horizontal lines drawn diagonally. These patterns are the continuous pattern that helps the trader to predict the continuation of a trend.
The pattern is formed with the price first moving in a particular trend, entering into a range zone for some time, and finally breaking out the Triangle pattern formation. Depending on the pattern formed, the price could move in any direction, mainly in the same direction earlier.
Thus, a trader’s task is to read the breakout and enter the breakout direction. A successful prediction and trade will give a reasonable risk: rewards as traders know the price will move in.
How to trade?
Trading this pattern is more or less a part of price action trading where you do not use any indicator and just trade with the help of the patterns formed on the charts.
Well, there is no strict rule of trading with its help. You may use any indicator with the combination of price action and make it more effective.
Below is the illustration of three types.
Symmetrical Triangle patterns
It is the only one among the three that anticipates both bearish and bullish continuation or reversal price movement. The structure is formed between two trendlines drawn diagonally with a wide distance and getting up close over time.
The price runs into a consolidation state for a while until it reaches the apex of the Triangle and eventually breaks out of support or resistance (S&R).
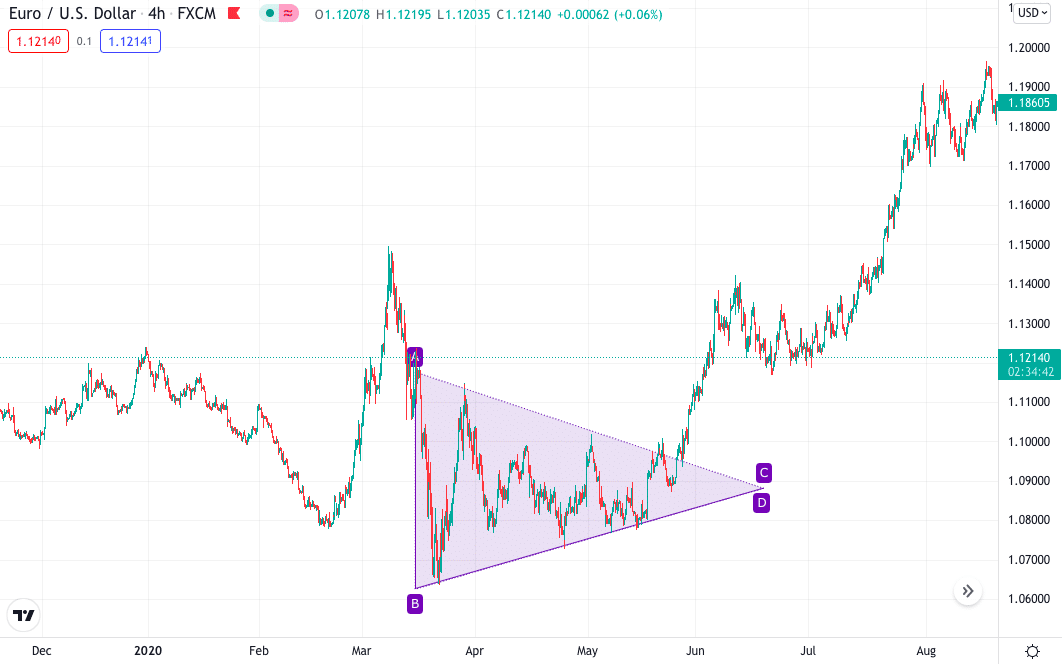
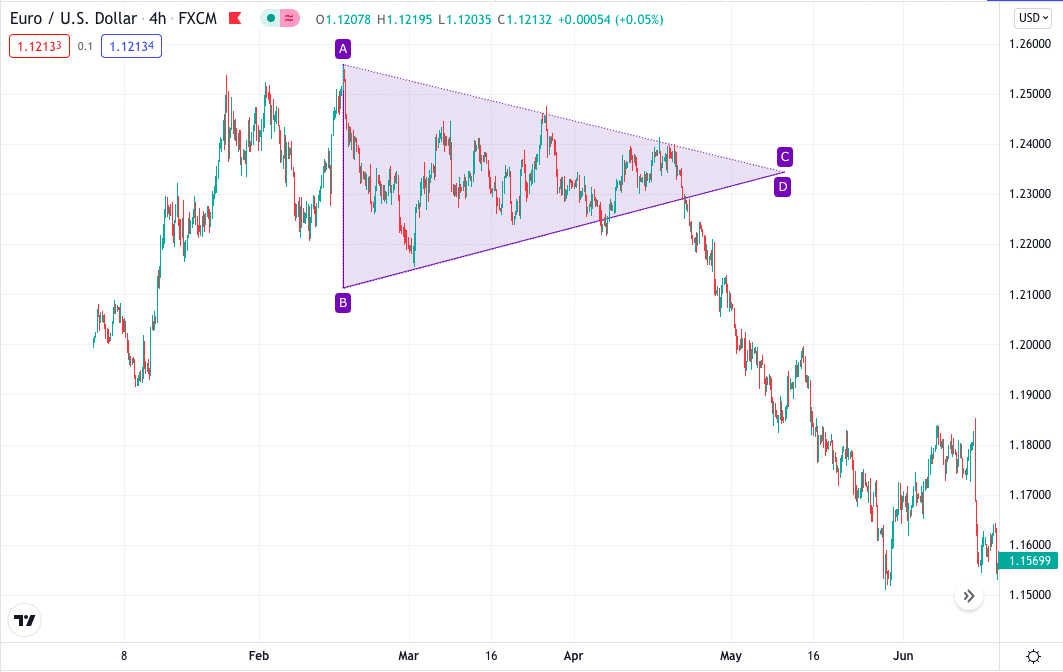
| Bullish trade setup | Bearish trade setup |
| 
|
You can see how the market performed in the above charts after breaking out from the symmetrical pattern.
- In the bullish trade setup, the price was first moving down, then went into a range state, forming the pattern and finally breaking out of the pattern and moving up.
- In the bearish setup price was moving up, it started moving down after the breakout.
Ascending Triangle pattern
It shows that a bullish movement is due after the successful breakout of the pattern. Two lines form the pattern:
- The first is a flat straight horizontal line representing the resistance.
- The other is the diagonal line that acts as a support.
The price swings between these two lines, and the traders wait for the price to break and move above the resistance.
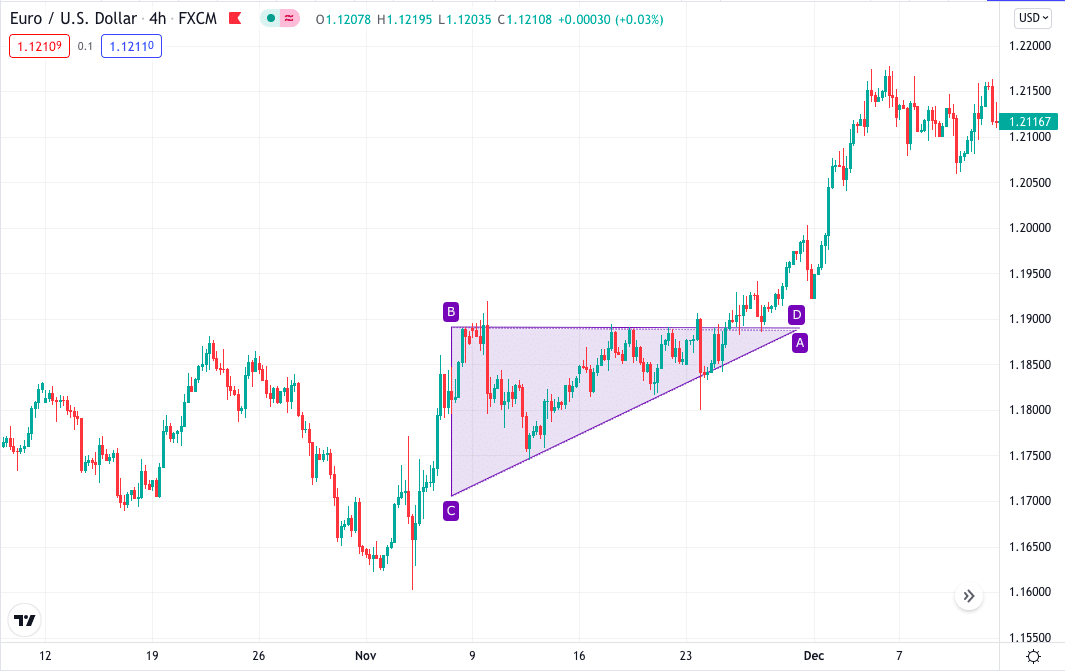
The above chart shows the flat and diagonal lines forming the pattern; after the successful breakout, the market went up.
Descending Triangle pattern
It shows that a bearish movement is due after the successful breakout of the pattern. Two lines form the pattern; the first is a flat straight horizontal line representing the support, while the other is the diagonal line that acts as a resistance.
The price swings between these two lines, and the traders wait to break and move below the support.
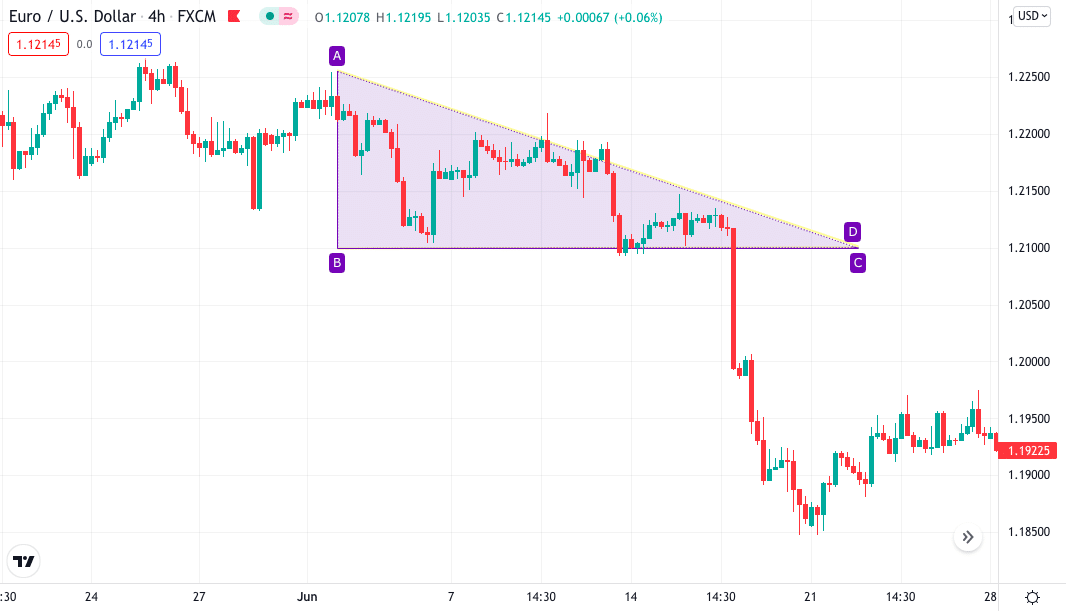
The above chart shows descending triangle pattern; you can see the flat line and the diagonal line forming the pattern; after the successful breakout, the market went down.
Entry
While trading it, you will first wait for the successful break of the pattern. Once you know the direction, move to the lower time frame, like 1hr or 30min, and look for the close of the candle below or above the pattern. Enter on the next candle after the market, following the breakout direction.
Stop loss
It will be 18-20 pips away from the entry.
Take profit
Look for 1:3 risk:rewards ratio of the next dynamic S&R on the higher time frame, say 4hr.
How to manage the risks?
Triangle patterns are accurate and make a lot of money for you if you trade them properly. But it also happens that sometimes you may encounter fake breakouts. If you enter the market in the opposite direction, it may lead to huge losses.
The best risk management move would be putting your stop-loss in place. Please do not enter the market without a stop loss. Also, take just 3-4% risk on a single trade.
Pros and cons
Triangle pattern is easy to find on the chart and trade, but do you know it also has a few cons associated with it? Below are the few pros and cons you must know before making this pattern your favorite one.
| Worth to use | Worth to getaway |
| • These patterns are easy to find on the chart once you know the structure and where to find it. | • If you are a beginner, it might be difficult for you to identify the pattern. |
| • You can find this pattern in any financial market, say FX, stocks, crypto, etc. This, in term, makes it a universal pattern. | • Fake breakouts can happen any time in the market, leading to traders taking take in the opposite direction. |
| • Triangle pattern breakout gives the best risk: rewards as the pattern indicates in advance that a breakout is expected. It helps to predict the breakout direction and expect huge profits. |
Final thoughts
Any candlestick pattern or structure must not be traded alone to get more accurate and high probability trades, as it is always better to use other strategies with it.
You can also combine technical tools and indicators with it. The more the confluence, the better. While trading these patterns, you must recognize fake setups and use them to your advantage. The pattern sometimes does not work if the market volatility is higher.