Harmonic patterns are geometric patterns on the chart used to forecast future price movements, just like price action, Elliott wave, or any indicator. Among the five types of these patterns, we also have the Butterfly pattern of a structure similar to a butterfly.
It is commonly used among market participants who rely on harmonic tools for their trading. This pattern denotes that a reversal is due. According to experienced traders, harmonic tools work 70-75% of the time if used correctly.
The pattern here is sporadic and is known and used by many market participants. Let’s learn how to use it and open for yourself an easy way to make money.
Three things to know before starting:
- It is a form of harmonic pattern that is used for trading reversals.
- It has both bullish and bearish forms and looks similar to missed double top and bottom.
- It follows specific Fibo ratios, which make them more prominent.
What is the Butterfly pattern?
Every trader continuously looks to catch a new trend at the start. The Butterfly tool is a harmonic reversal chart pattern that technical traders use to predict market reversals and future prices.
It mainly occurs at the end of an extended price movement with consolidation; furthermore, it is applied to discover the end of a trending market movement and a new trend.
Bryce Gilmore discovered it using his Wave trader software program. The pattern formation usually happens near the extreme lows and highs of the market and predicts a reversal.
How to identify the pattern?
| 
|
It is easy to identify if you know missed Double top and Bottom pattern formation. This tool can be both bullish and bearish. When you see the price making something like W or M, you can start checking if it is one of the types of Butterfly tools.
It is constructed with the help of four lines that gives it its shape. The lines are marked as X-A, A-B, B-C, and C-D. It helps traders determine when a current price move is probably getting to its end. This means traders can enter the market as the price changes direction.
Below is the denotation of how price moves to form the pattern.
X-A
When the market travels from X to A, it is considered to be the first move.
A-B
This price movement from A to B is considered crucial and should only pull back 78.6% of the initial X-A move.
B-C
The price movement from B to C must be either 38.2% or 88.6% retracement of the A-B move.
C-D
If BC is 38.2% of AB, then CD is likely to reach the 161.8% extension of BC. However, if BC is 88.6% of AB, then CD is likely to reach the 261.8% extension of BC.
How to trade it?
Once we have successfully figured out and drawn our pattern, we will now discuss a variation based mainly on using the BC projection to find the D point. We will now go through both the bullish and bearish examples.
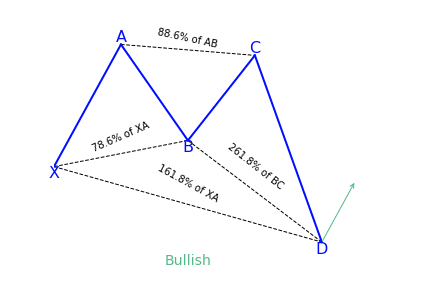
Bullish trade setup
The above chart shows the bullish trade setup and the upwards price movement after point D.
Entry
You will open the buying position when the price reacts at D level and starts moving up.
- CD sets a bottom at 161.8% of BC if BC retraces 38.2% of AB.
- Or after CD sets a bottom at 261.8% of BC if BC retraces 88.6% of AB.
Stop loss
Place it 10-15 pips below the newly formed D bottom swing. You can change the above pips by analyzing the volatility in the asset you are trading.
Take profit
It depends on the market participant, but the recommendation targets the 161.8% extension of the CD move. You may also close the trade when you are happy with the profit or if any new support or resistance is near.
Here points B, C, and A swing is also important to consider. Look into the price behavior after it reaches these swings and takes profits.
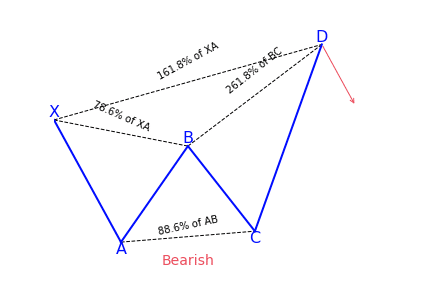
Bearish trade setup
The above chart shows the bearish trade setup and the downwards price movement after point D.
Entry
If you are trading a bearish Butterfly, you will sell the FX pair when the price reacts to the D level after:
- CD sets a top at 161.8% of BC if BC retraces 38.2% of AB.
- Or after CD sets a top at 261.8% of BC if BC retraces 88.6% of AB.
Stop loss
Place it 10-15 pips below the newly formed D bottom swing. You can change the above pips by analyzing the volatility in the asset you are trading.
Take profit
It depends on the market participant, but the recommendation targets the 161.8% extension of the CD move. You may also close the trade when you are happy with the profit or if any new support or resistance is near.
Here points B, C, and A swing is also important to consider. Look into the price behavior after it reaches these swings and takes profits.
Pros and cons
Like every other trading pattern, this pattern also has some pros and cons that you must know before using it.
| Worth to use | Worth to getaway |
| •These patterns are easy to understand as it is similar to a missed double top and bottom. | •Harmonic pattern trading requires a broader knowledge of forex analysis to contextualize predictive patterns. |
| •Compared to other chart patterns, Butterfly patterns can offer strong indications. | •The rigid structure and geometric calculation can be a point of frustration for some traders. |
| •Anecdotal evidence suggests the pattern is one of the best ways to identify profit opportunities. | •In general, this pattern type is less frequently identified than other harmonic patterns. |
Final thoughts
The pattern is a graphical structure consisting of five points, and trading on it has clear rules for entering and exiting the market. In general, it is a strategy for working with such patterns, not just a description of them.
A trader opens and closes positions near the levels that he built according to the Fibo, learns to manage his trade, determines a high-quality entry into the market, and divides the position into parts for comfortable work.
It is advisable to trade the pattern in the direction of the prevailing trend. Then the potential profit will be much greater. The investor should also keep in mind the rules of money management.