Forex trading can be a fascinating new hobby or even a career to follow. Many people have opted to go down this route because it potentially generates wealth in the long term.
You will soon discover that there’s an abundance of strategies and techniques to follow. Since the currency market is so big and volatile, they influence each other, and many factors drive the market price. Some of these factors give rise to currency correlation.
Traders who know mathematics come up with indicators to increase the profitability of their trades. Their technical creations are the work of practitioners. However, academics have gifted the world with useful statistical tools.
One of them is the FX correlation. Beginners and hardened traders, we invite you to a cognitive and practical study of the role and place of correlation in the FX market.
Brief about currency correlation?
The term correlation means how something is related to another. When we say it in FX, it means which currency pair moves similar and which moves opposite.
As we have similarities and dissimilarities in the price movement, we call it positively and negatively correlated. By now, you would have guessed that when two currency pairs move in the same direction, we call them positively correlated pairs. Nonetheless, if it moves in a different direction, we call it negatively correlated pairs.
The degree of the similarity determines how strong the correlation is between the pairs.
If you buy currency pairs with a positive correlation, you stand to double your profit or loss depending on the success of the trade. If you buy two negatively correlated currencies, you are betting on one pair increasing and one falling.
This way, you hedge the position by offsetting your losses with the other trade.
What is the correlation coefficient?
The degree of how strong or weak a correlation is the coefficient, which ranges from -100 to 100 or -1 to 1. If a pair has a value in the range of -100, it means that the pair moves almost identically in opposite directions.
A pair with a value above 100 are almost identically moving in the same direction.
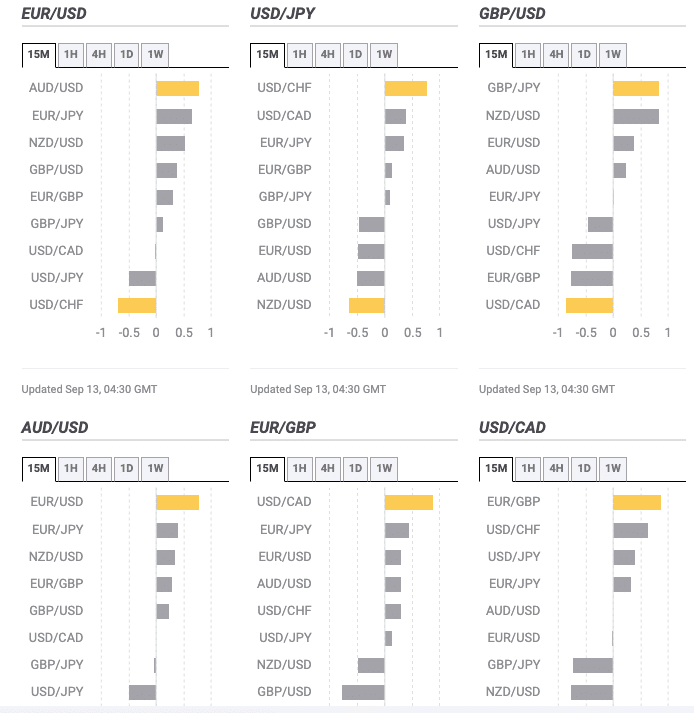
It is important to note that the volume of the movement is not the determining factor but rather the direction of the price. Pairs with a high coefficient might not move the same number of pips in a particular direction.
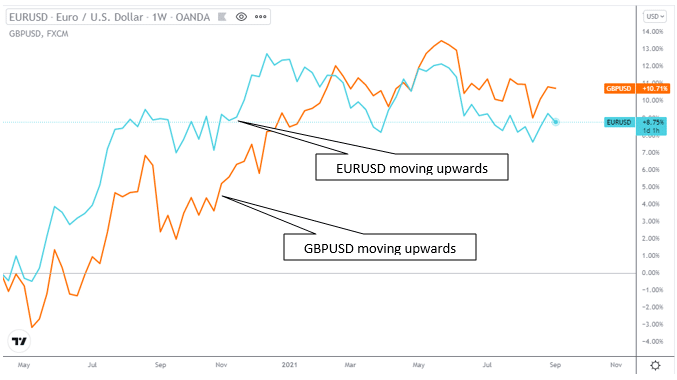
In the above example, you can see the movement of positively correlated pairs. The coefficient for them is above 77, which is considered high.
The orange line represents the GBP/USD pair, and the blue line is the EUR/USD pair. We can see that the pair has a strong correlation, as they move in the same direction most of the time.

An example of negatively correlated pairs is GBP/USD and EUR/GBP, which have a coefficient of -90.
The blue line and EUR/GBP represent GBP/USD by the orange line. The pairs move in opposite directions most of the time. When GBP/USD moves upwards, EUR/GBP moves downwards.
As we mentioned, the correlation is not dependent on the number of pips, as we see from the charts. However, direction is the primary factor to consider.
Due to this correlation coefficient, traders have developed powerful strategies to take advantage of the market.
Strategy 1. Hedging forex pairs
It is a technique you can use to offset your losses by buying one pair and selling another pair. This is especially helpful if you don’t want to close the trade, which is at a loss.
It often happens that you trade a pair, and it moves in the opposite direction. This means you are at a loss. You can find the highly correlated pair and offset your losses this way.
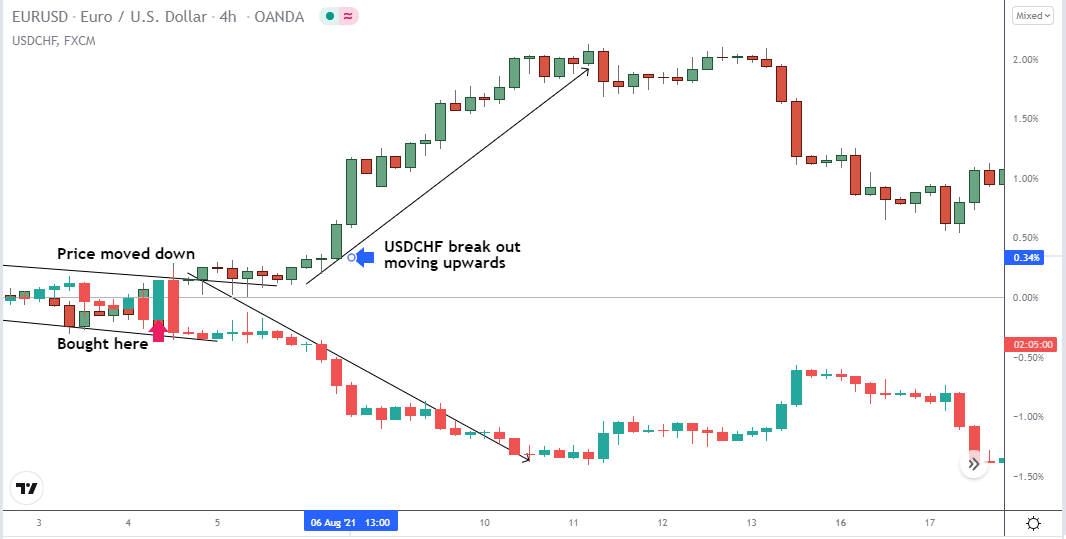
For this strategy, we will use the EUR/USD and USD/CHF pairs. The two pairs have a correlation coefficient of -77.
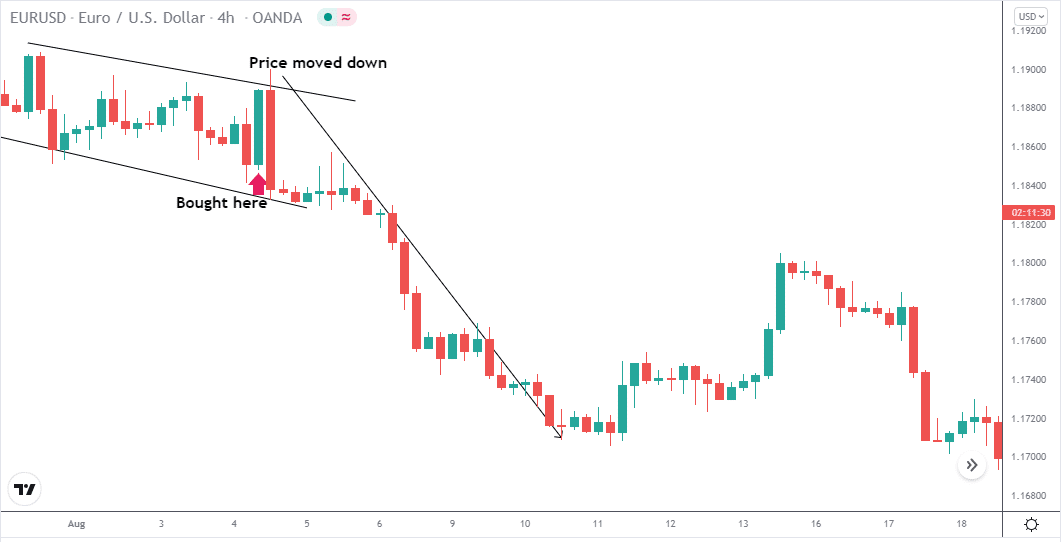
We will assume that you analyzed the pair and decided to buy EUR/USD. The pair moved in your direction for four hours, and then the price reversed down. You were in profit for a while. However, you failed to protect your profit, and you are now at a loss.
From the chart, we can see the price broke out from the channel and is moving downwards.
A way to counteract your losses is to trade the pair with the highest negative correlation like USDCHF. It is important to note that you should enter the market before the trend picks up momentum to maximize profits.
To execute this strategy, we need to confirm the following:
- Look for signs of rejection
- Identify a breakout candlestick
- Enter when the price retest the same level
- Confirm the trend and buy USD/CHF
Strategy 2. Correlated commodities
The second strategy is unique and yields more profit as it involves higher volatility assets, i.e., commodities. In FX, not only currency pairs but even commodities are correlated. Some commodities like gold and silver make a good positive correlated asset.
An example of this is gold (XAU/USD) and silver (XAG/USD), which arose back in time when these two currencies were the medium of exchange for goods and services. Gold and silver pairs have a correlation coefficient of 81. This is higher than 70 and, therefore, has a strong positive correlation.
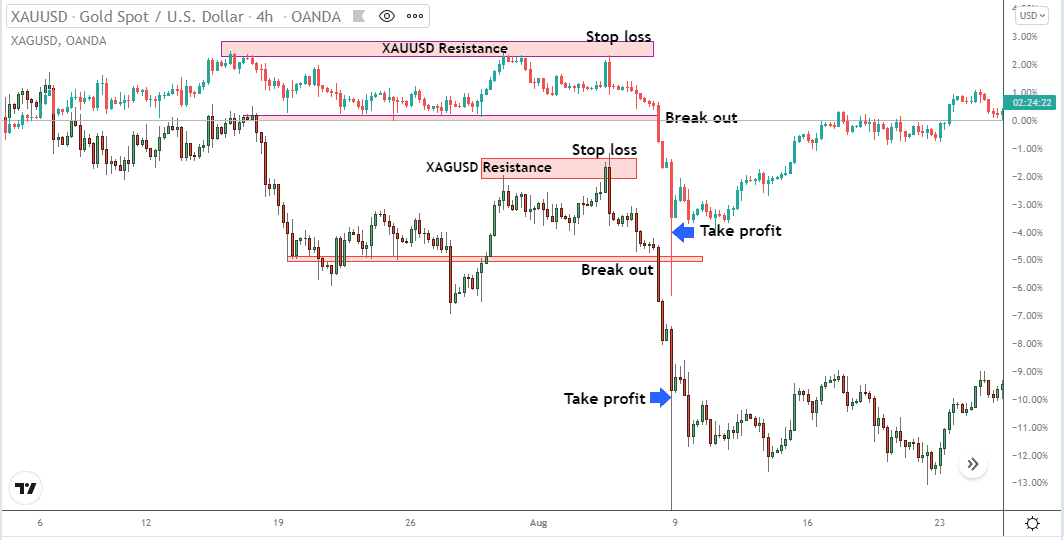
From this chart, we learned the following:
- Both pairs reached a resistance level
- Price broke out
- A solid downward trend occurred
The chart clearly shows that the two pairs have a strong positive correlation and presents an excellent opportunity to double up profits when trading in the same direction.
Strategy 3: Negatively correlated pairs
EUR/GBP has a correlation coefficient of -90 to GBP/USD. Therefore, the pair is negatively correlated.
In this scenario, you can buy or sell both pairs at the same time.
- Analyze the trend
- Identify good entry
- Set stop and take profit targets
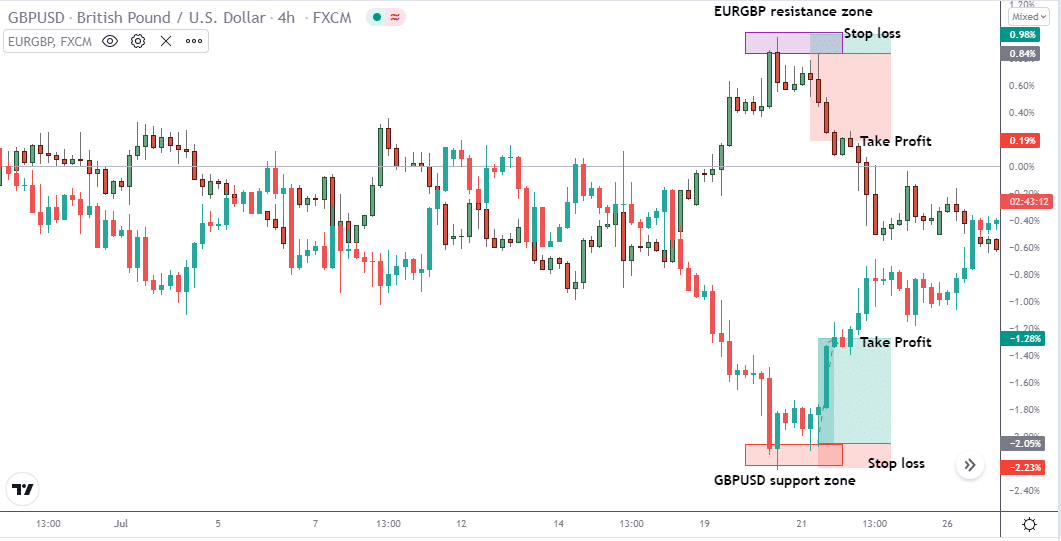
From this chart of the two pairs, we have learned the following:
- EUR/GBP reached a resistance level
- Price shows indications of moving downwards
- GBP/USD reached a support level
- The price shows signs of moving upwards
We can see from the chart the two pairs move in opposite directions. Therefore, we sell EUR/GBP and buy GBP/USD since the two have a strong negative correlation. And our analysis confirms the price direction.
By following this strategy, you can hedge your position and make a profit from both pairs.
Pros & cons of trading correlations
Trading currency correlation seems like a profitable strategy; however, it is not as simple as it looks, and you have to consider additional risks. We will list a few pros and cons of correlated trading pairs.
| Pros | Cons |
| Increase profits You can increase your chances of profiting significantly by trading correlated pairs since you benefit from more than one pair in a particular direction. | Losses due to bad analysis The risk of a poor technical analysis can cost you since you will rely on this to enter the trade. If both pairs move in the opposite direction than you anticipated, you might find it challenging to hedge your positions. |
| Minimize risk by hedging You can reduce your losses by hedging negatively correlated pairs. | Pairs don’t move the same volume Correlated pairs don’t move the same number of pips. One pair can move up by 50 pips, while its counter pair can move down by 100 pairs, even for closely correlated pairs. |
| Benefit from trading correlated commodity pairs Gold and silver pairs are highly profitable, and if you identify an opportunity to trade both simultaneously, you can even profit much more. | At different time intervals, the correlation is different At 15 minutes, the relationship is positive, and it is already negative on the daily time frame. In addition, it changes over time: today is, tomorrow is gone. |
Final thoughts
Currency correlations can be another good strategy to use. However, you need in-depth knowledge of price action or technical analysis. It is not as simple as buying or selling based on the correlation.
If you get it wrong, it can cost you and damage your trading portfolio. Therefore, we need to take careful consideration and trade with minimal risk so that if we need to exit the market, we can do so without significant losses.