More than 80% of retail traders lose money in forex trading, and the main reason for this is the lack of understanding. The global FX market is driven by large institutions, banks, and multinational companies with enough buying and selling powers to make the price move.
On the other hand, retail traders have a minor significance here that needs additional attention to the price action and larger players’ dominance. As indicators are laggy, using a trading method like naked forex trading would solve the issue where traders can quickly make trading decisions.
The following section will see how naked forex trading works, including the exact buying and selling ideas.
Naked forex trading: top three influential factors
This trading represents the true story of larger players’ activity in the market. Therefore, traders can easily anticipate the future price direction with a higher success rate. Unlike other trading methods, the key uniqueness in this method is that you can avoid messy indicators keeping the probability stable.
Let’s see the top influential factors related to naked forex trading:
- Understand the supply and demand
Supply and demand are the core elements in financial trading where supply exceeds demand indicating a sell signal, and demand exceeds supply a buy. In the naked chart, the SnD levels are easy to spot in the naked chart without any struggle.
- Understand the price action
Price action represents the price behavior using candlesticks, trends, momentum, etc. The naked chart allows investors to make smarter and quicker decisions.
- Easy to read
The forex trading chart is like a book where traders should read it from left to right. Candles and swing levels in the chart represent a story where the naked chart makes it easy to understand.
What is naked forex trading?
It is a process of reading the market without any help from indicators. As a result, investors can eliminate complex calculations of indicators that may delay the trading decision with an information overload.
The main aim of naked forex trading is to combine the live price action with previous data and anticipate the future price precisely. The naked chart allows reading the price in real-time, where every new candle shows what is happening in the live market. Moreover, it is easy to spot the early trend with a naked chart where indicators are quite laggy.
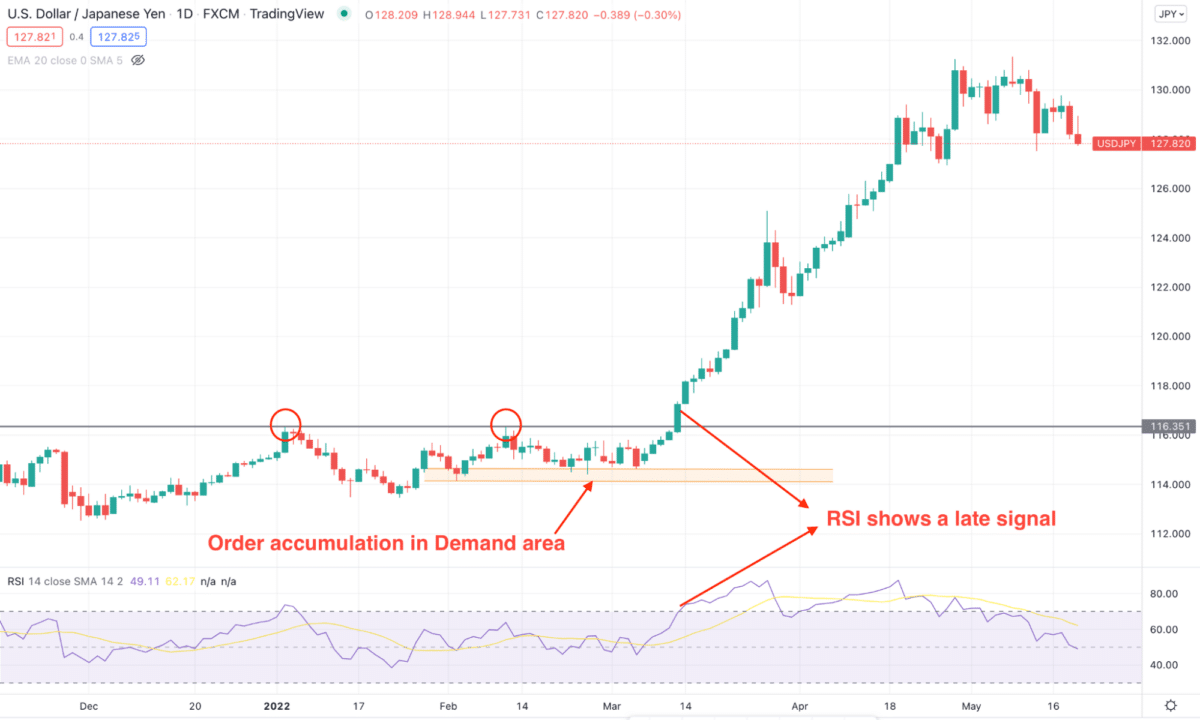
The above example shows how the naked chart shows a buy signal from the demand level as the price failed to break the order block after forming the double top pattern. On the other hand, RSI shows the buy signal once the price has already moved above the resistance.
How does a naked forex trading strategy work?
Naked forex trading needs a deeper understanding of candlesticks and price action so that traders can have a quicker trading decision. The first thing a trader should have is understanding of market trends using swings. Moreover, this method applies to taking both trend and counter-trend trades.
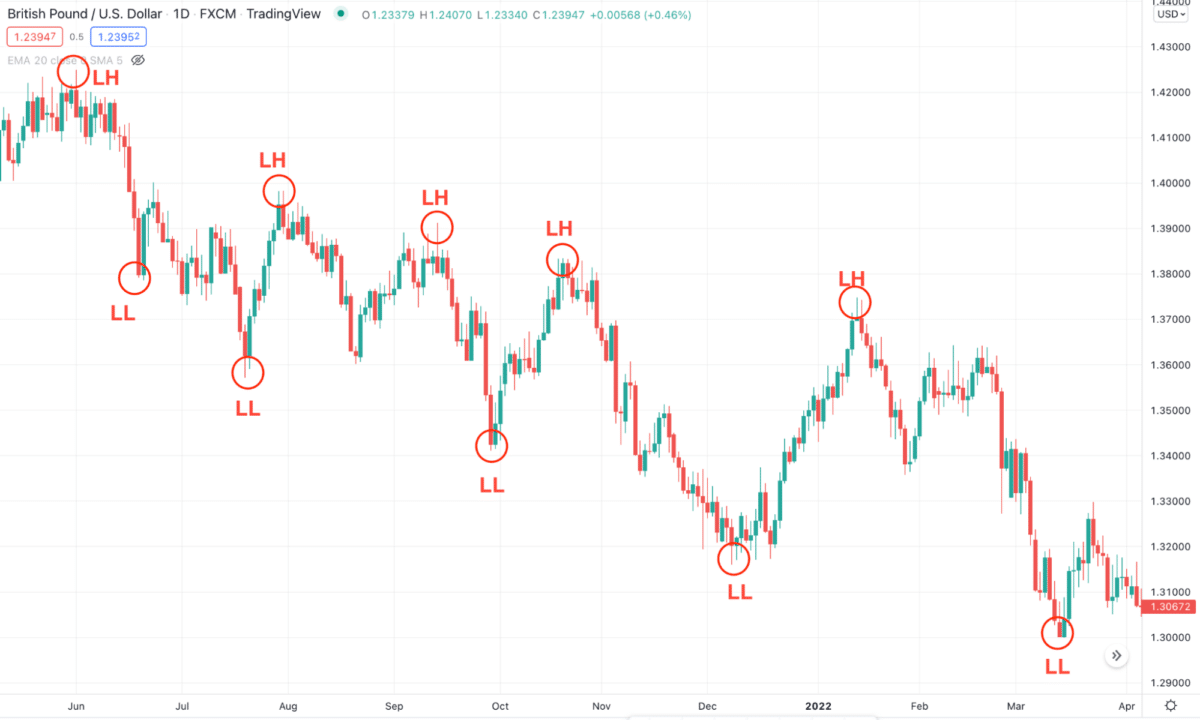
The above image shows how bearish trend forms in the GBP/USD daily chart with lower lows and lower highs formation. The opposite version applies to the bullish market.
After finding the trend, investors should use price action and candlesticks to join the direction from a reliable support/resistance or supply/demand area.
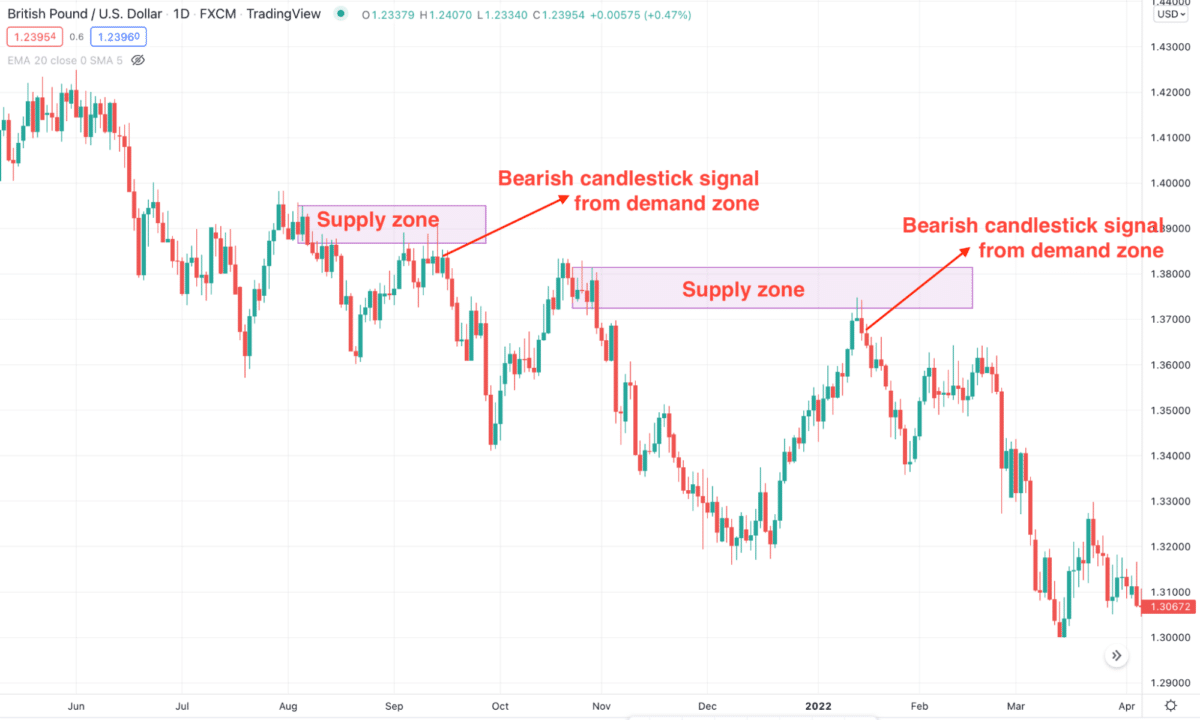
The above image shows the same GBP/USD daily chart where the sell signal with candlestick formation comes from the supply zone.
Easy naked forex trading strategy to earn $500 per day
In this section, we will see a simple naked forex trading strategy applicable to the intraday chart. This strategy aims to grab the benefit from London, opening momentum towards the trend. You can easily pick 20-100 pips a day where making a $500 profit would be easy.
Bullish trade scenario
First, move to the daily chart and identify the market trend. If the price is trending lower from a vital supply area, we will take sell trades. On the other hand, if the price moves up from the demand area, we will open buy trades.
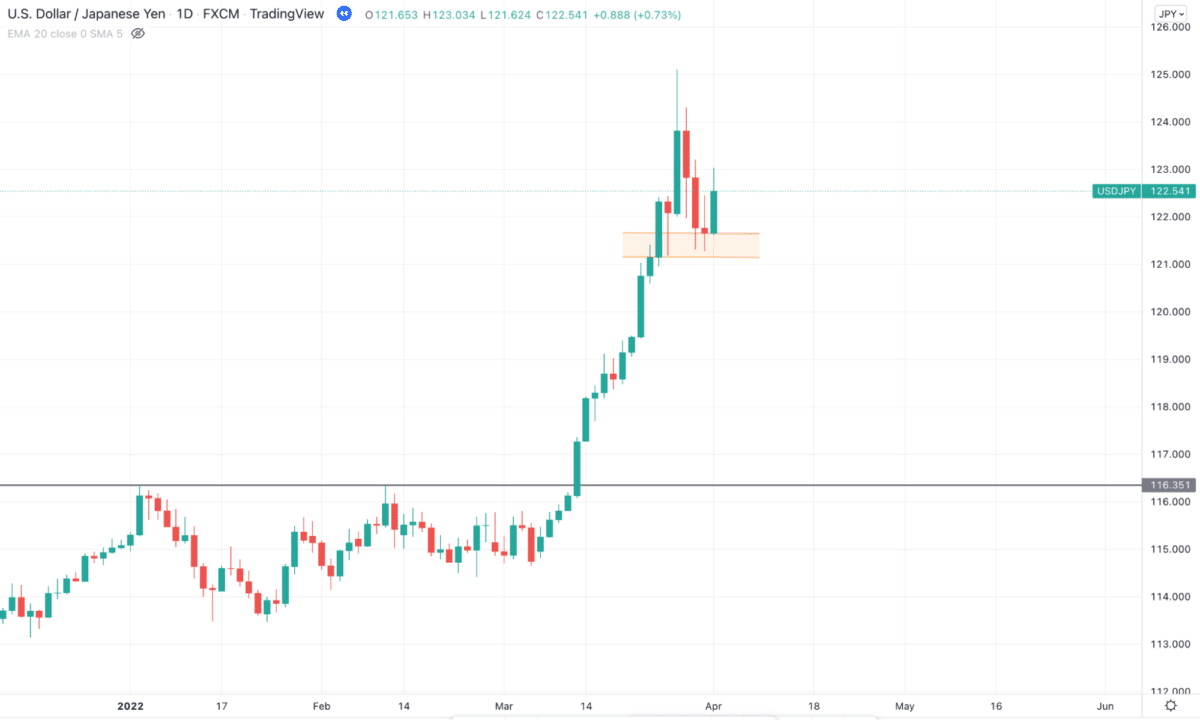
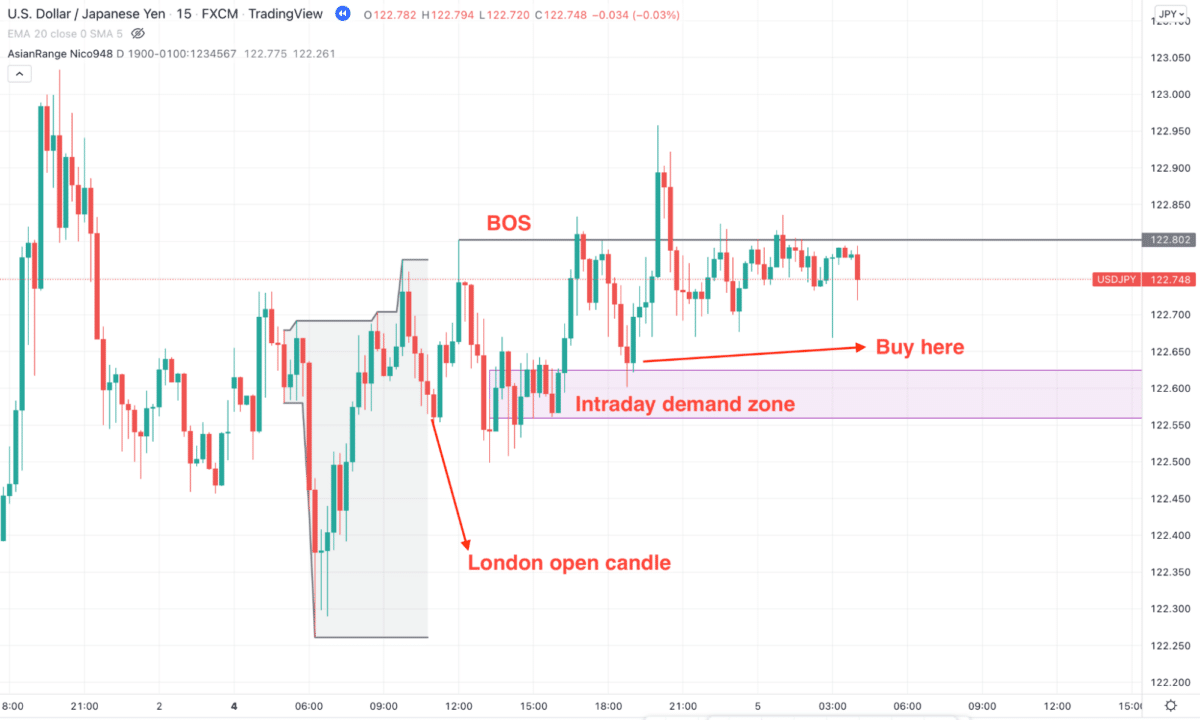
In the above image, the trend is bullish, where the price formed a bullish daily candle after rejecting the daily demand. Now move to the London opening on the next day to take a buy trade after a bearish correction. In that case, the price should make a new high with a bullish break of structure where further bullish rejection from the demand area will validate the buy trade.
Bearish trade scenario
The same scenario applies to the bearish market, where the price should move lower in the daily chart opening a bearish opportunity.
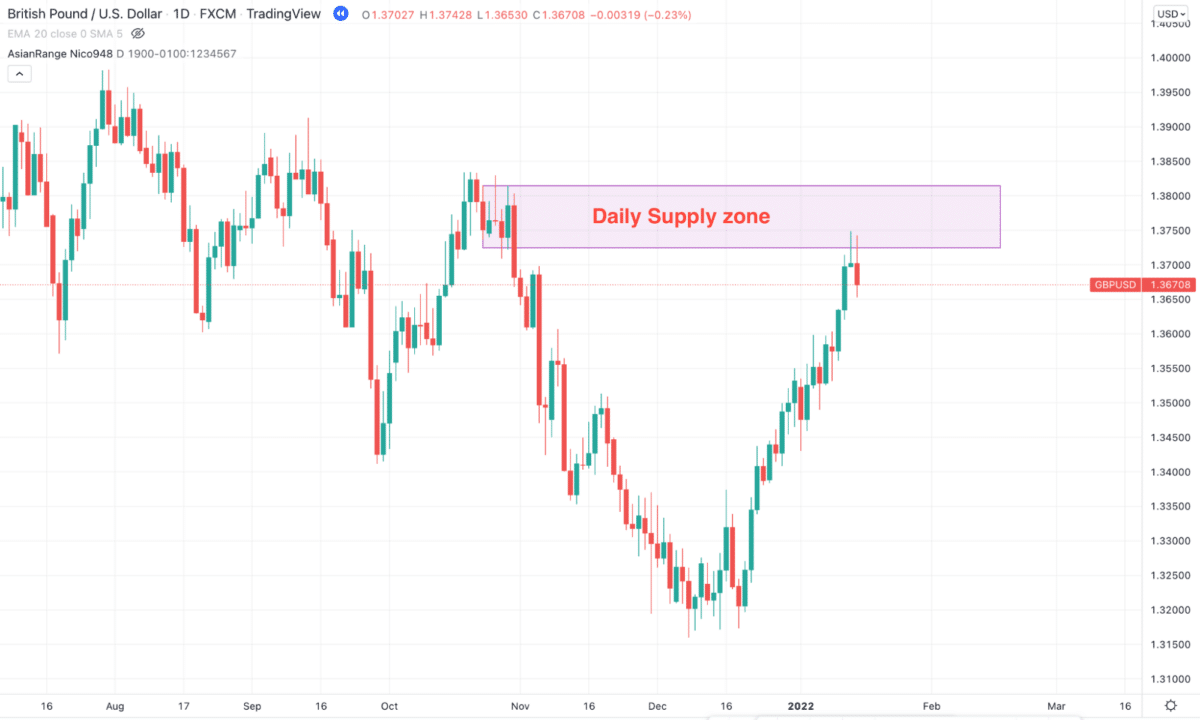
The above image shows how the price rejects the daily supply zone with a bearish candle opening a selling opportunity in the intraday chart. Now move to the M15 time frame on the London season and find a bearish break of structure and correction towards the intraday supply area.
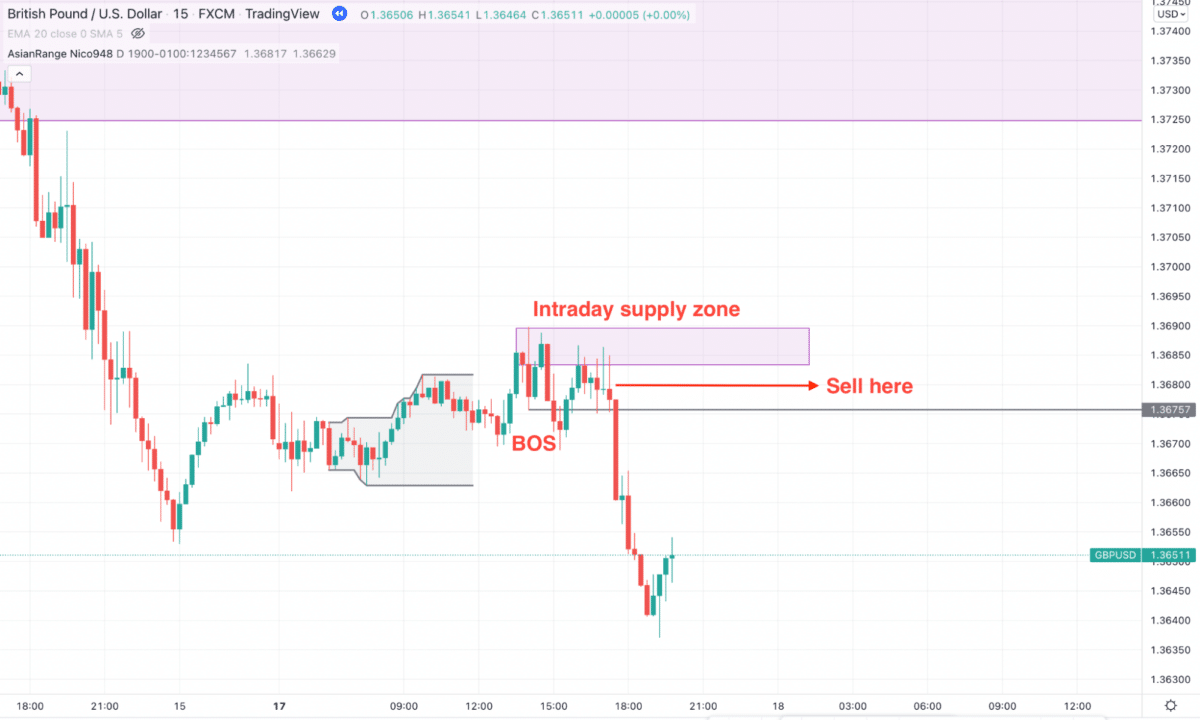
The above image shows how the price formed an intraday supply zone with a bearish break of structure where the trading entry is valid once a bearish rejection candle appears from the supply zone. For this example, the price moved down immediately with a 5X gain.
Pros and cons
| Worth to use | Worth to getaway |
| This method needs close attention to candlesticks and price action, which is challenging to learn for new traders. | Getting higher returns from a small risk is possible with this method. |
| It needs a quicker trading decision with additional attention to the chart. | Quicker and faster trading strategy compared to indicator based systems. |
| This trading strategy needs deep knowledge of trade management and risk management. | Easy to read the chart like a book. |
Final thoughts
Naked forex trading does not require any indicators where trends are easy to spot by looking at swing highs and lows. Moreover, investors can increase the trade probability by including live order book flows, imbalances, and intraday high volume levels.
However, the basic use of support resistance, candlesticks, and price action are complementary elements in naked forex trading.
Finally, financial traders aim to anticipate the price movement and make money with some unavoidable risks. Therefore, besides using the naked chart strategy, investors should follow a risk management system to get the ultimate result.