In the commercial arena, preparation is always an essential factor in achieving success. Part of the preparation a trader must do is arm yourself with knowledge of the specific asset, the market in general, good live trading experience, and a good familiarity with candlestick patterns.
Candlestick patterns play an essential role in assessing possible market direction. Over a dozen candlestick patterns commonly used by experienced traders can be very effective when used and interpreted accordingly.
Among the most popular candlestick patterns is the Evening star pattern. So what is this pattern, and how can you apply it to an actual trade?
What is the Evening star pattern?
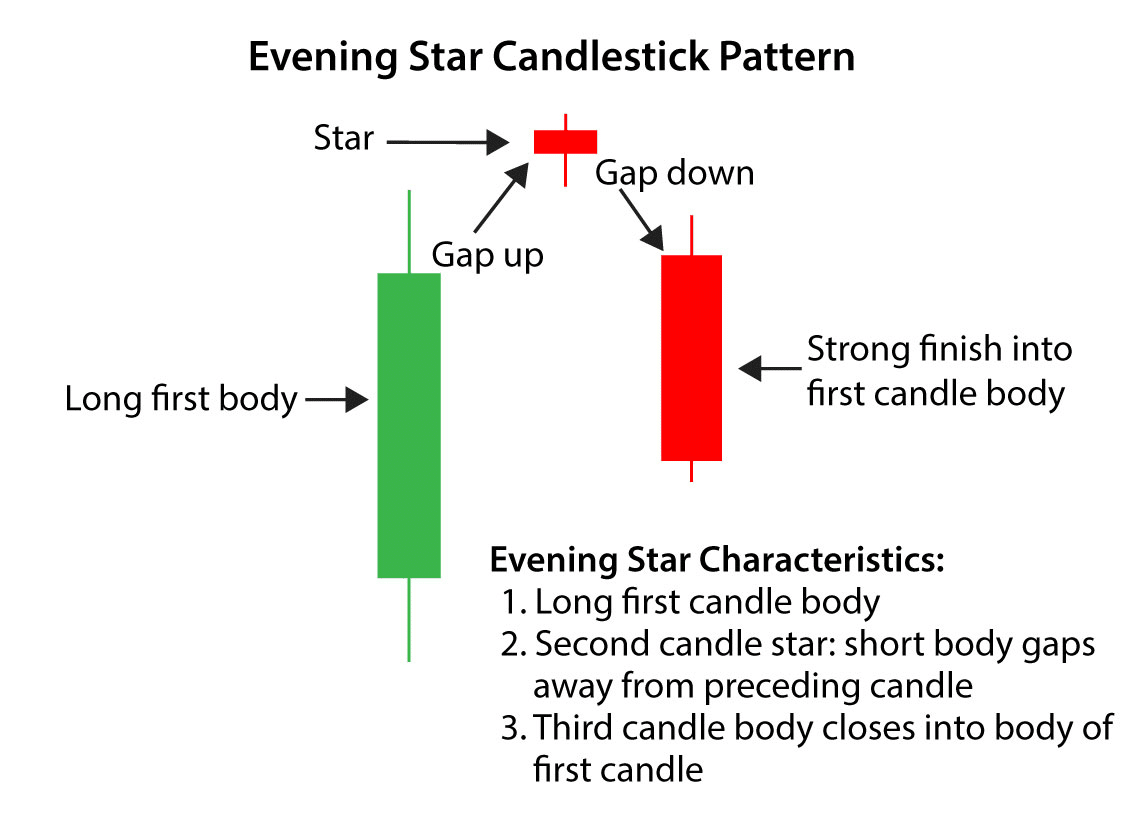
It is a bearish reversal pattern with three candles:
- Giant bullish
- Small-bodied
- Bearish
Typically, this pattern arises near the top of an upward trend, indicating a weakness in the bullish and the potential for a bearish reversal. The Morning star pattern is a bullish reversal candlestick pattern that is the opposite of the Evening star.

How to identify the pattern?
On forex charts, identifying this pattern entails more than just recognizing the three main candles. Understanding past price action and where the pattern appears within the present trend is necessary.
Determine whether or not there is an existing uptrend
The market should have higher highs and lower lows.
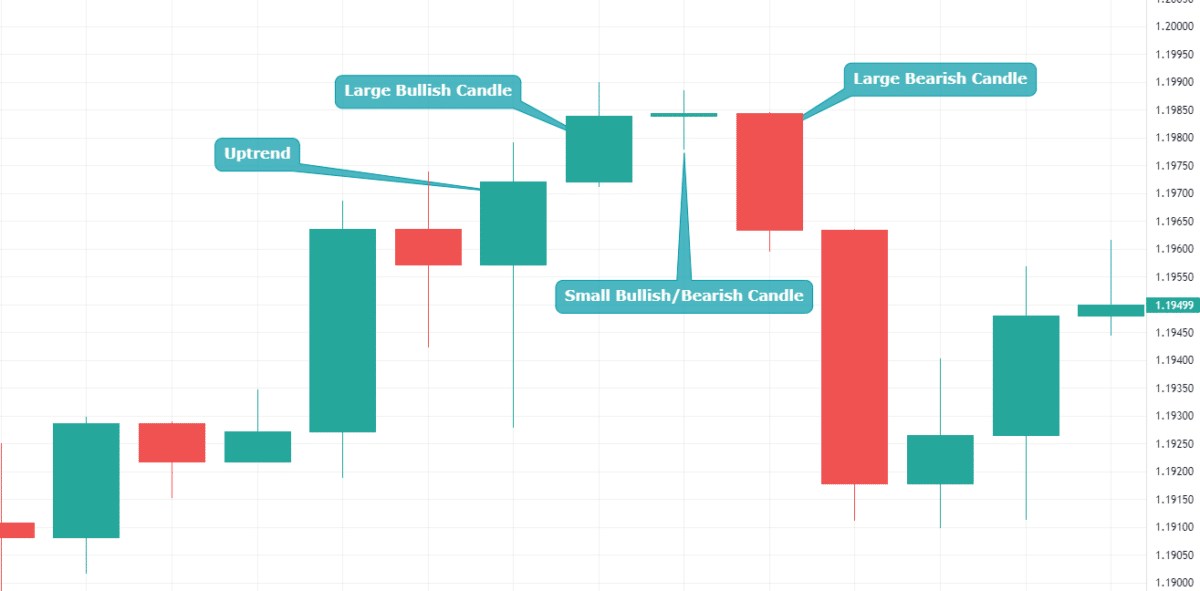
Big bullish candle
This candle is the consequence of a solid bullish bias and a continuation of the current uptrend. There is no evidence of a reversal at this time; therefore, traders should only be searching for long bets.
Small bullish/bearish candle
The second candle is small, commonly referred to as a Doji candle, and signals the start of a new rally. This Doji lookalike candle can be opened with a gap; however, it represents indecision among bulls and bears. Furthermore, it signifies that the bullish bias has weakened in the market, and sellers may dominate soon.
Large bearish candle
This candle shows the first real hint of new selling pressure. This candle gaps down from the previous candle’s closure in non-forex markets, signaling the start of a fresh bearish trend.
Bearish price action
Traders will notice lower highs and lower lows after a successful reversal, but they should always control the danger of a failed move by using well-placed stops.

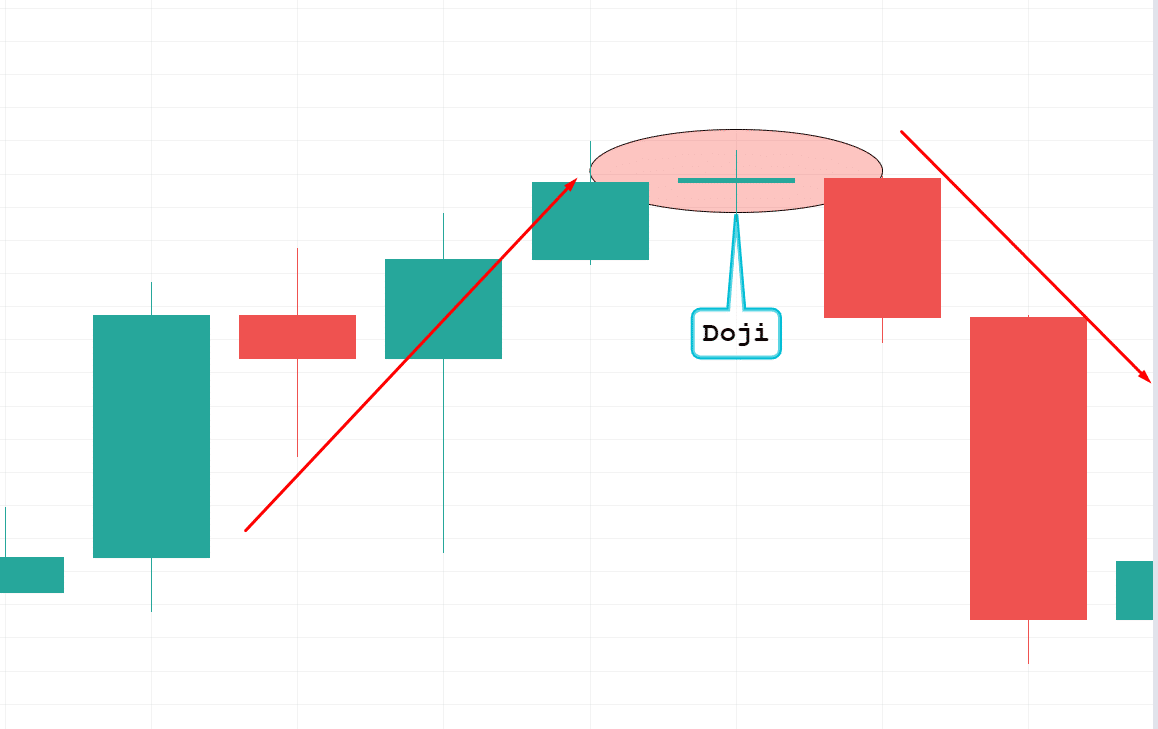
Typically, traders lookout for market hesitation signals, such as a drop in purchasing pressure that leaves the market flat. A Doji candle is most likely to appear in this spot.
Evening star pattern — Doji

Doji candle forms when the FX market opens and closes at the same level or very close to the same level. This ambiguity allows for a bearish move, as bears identify value at this level and prohibit further buying. This bearish confirmation comes in the form of the bearish candle that appears following the Doji.
How to trade it?
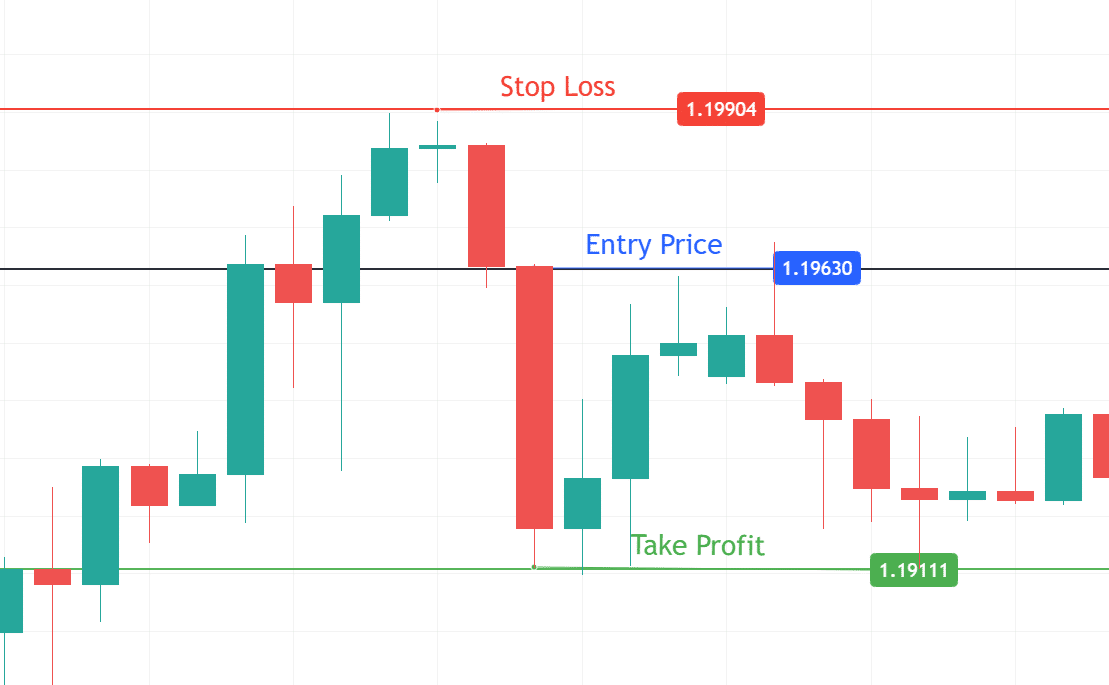
Let’s check the EUR/USD chart below, where an established uptrend precedes the emergence of the reversal pattern.

Looking at the chart, after the formation is complete, traders might look to enter at the very next candle’s open.
Entry price
We opened a sell trade in the above EUR/USD trade upon completion of a bearish engulfing candle at 1.1963. This bearish engulfing candle is followed by a Doji candle, suggesting weakness in the bullish trend.
More cautious traders may postpone their entry and wait to see if market movement moves lower. The disadvantage is that the trader may enter at a much lower level, especially in fast-moving markets.
Take profit
Prior levels of support or earlier areas of consolidation can be used as targets. Typically, the violated resistance level starts operating as a support level and vice versa. For example, we placed a take profit at 1.1911 level in the above trade as it previously worked as resistance.
Stop loss
Stops can be set above the most recent swing high, as a breach of this level would render the reversal worthless. For instance, we placed the stop loss at 1.1990, above the previous swing high level.
Because there are no assurances in the FX market, traders must always practice solid risk management while keeping a positive risk-to-reward ratio.
How to manage risks?
One of the most significant aspects of trading is risk management. The irony is that this is a crucial aspect of trading that is mostly unexplored. Many market participants want to start trading as soon as possible, regardless of their account size. This investing is referred to as gambling.
- Decide on your attitude to risk by calculating the risk/reward ratio, position size, and account balance as a percentage for each trade.
- Avoid losing money by using stop-loss orders to protect your investment.
- Use caution when it comes to leverage and going overboard. With higher leverage comes a higher level of exposure, so be very careful with it.
- Control your emotions at all times.
- Keep a journal to record your ideas so you can make judgments based on facts rather than gut impressions.
Final thoughts
The pattern is indeed one of the most reliable and easy-to-use candlestick patterns for trend reversals. It is much more accurate than others as it uses three candles, with the last one being more of a reversal confirmation.
Likewise, the pattern can be made more effective in combination, and by using other indicators and trend lines, it is possible to make the right decisions.
This pattern is what many traders consider to be a ‘hand’ when executing sell decisions, as it is an obvious sign of a reversal in the direction of a bear market or trend.
Now that you are thoroughly familiar with this tool, it is time to practice it in the real market.