If you are a participant in any financial market such as forex, CFD, stocks, etc., you probably know that you can’t make trades every day of the week. So the number of the total trading days of the year also varies. Their number is essential to the market participants and investors who have a schedule or trading plans according to the trading days.
You may be wondering now how many trading days in a year. This article includes trading days in 2022 and the trading calendar for the following year.
Moreover, we describe short-term and long-term strategies to make constant profits from the market during these trading days.
How many trading days in a year?
There are 252 trading days on average every year. So, in general, there are 21 trading days every month, so the quarterly number is 63 days. This number may vary as all year is not the same.
For example, in 2019, the number of trading days was 252; meanwhile, the following year, 2020, which was a leap year, trading days number of that year was 253. This number varies from several factors such as holidays, major events, weekends, and leap year.
How many trading days in 2022?
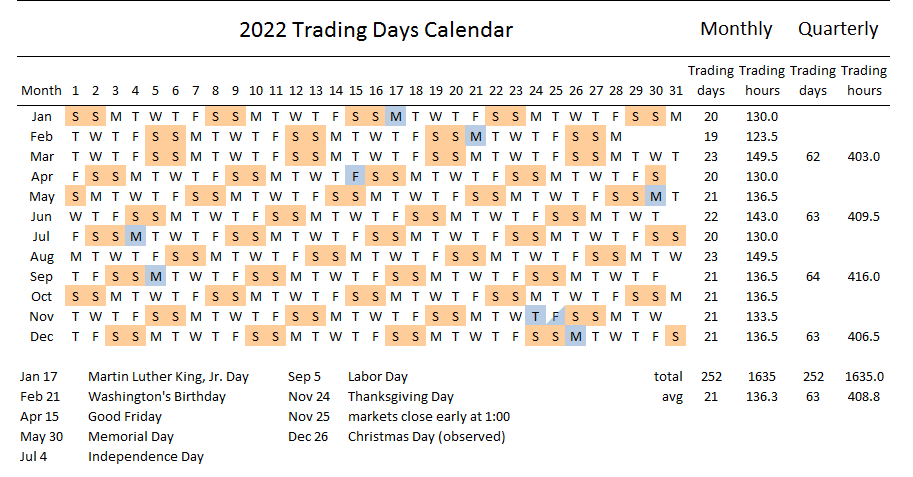
2022 contains 252 trading days in the whole year. In February, you will get the fewest 19 trading days; the most 23 trading days in March and August. Meanwhile, the average monthly trading days is 21 and quarterly 63. You will get 105 weekend days, counting every Saturday and Sunday of the week and nine holidays out of a total of 365 days.
Now we are attaching a trading day calendar of 2022.
Can you trade forex on weekends?
When you seek an answer if you can trade forex assets during weekends or not, the answer is yes. The fact is most dealers keep their operations closed during weekends as the banks and prominent financial institutes. Thus, you can trade forex on weekends, as it is an entirely decentralized marketplace that operates 24/7.
So there will be a lack of liquidity, and not suitable for traditional trading. The options are not limited to only forex; weekend trading for binary options, CFDs, stocks, etc., are also available.
A short-term strategy
We use two popular technical indicators in our short-term trading strategy:
- Parabolic SAR
- MACD
This strategy works fine on any time frame chart; we recommend using the hourly chart to trade with this strategy.
Bullish trade setup
This strategy suggests a bullish scenario when:
- Parabolic SAR dot appears below price candles.
- The blue signal line crosses above the red signal line of the MACD window, and both head toward the upside.
- MACD green histogram bars appear above the middle (0.0) line.
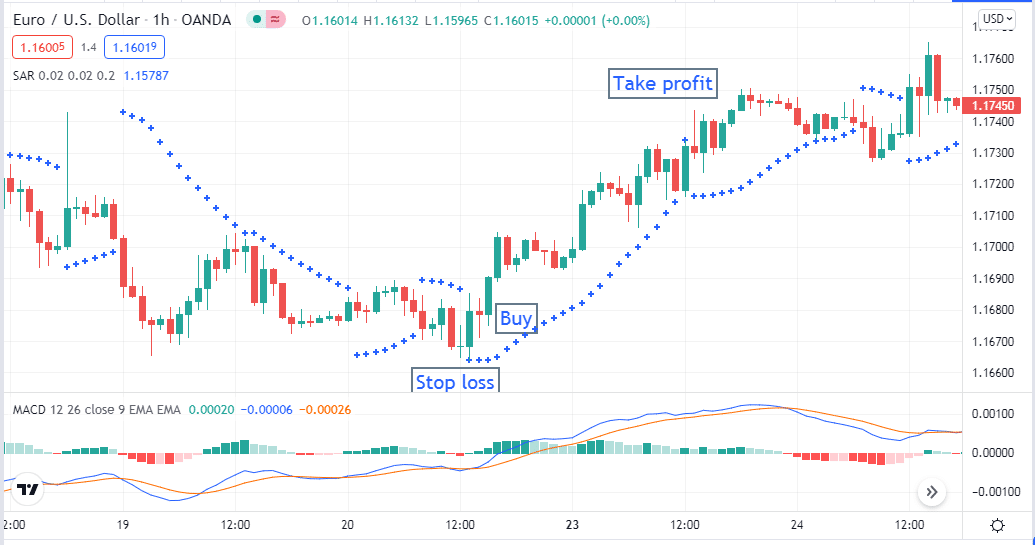
Entry
When the conditions above are true, wait until the current bullish candle closes, then place a buy order.
Stop loss
Initial stop loss will be below the recent swing low with a buffer of 5-10pips.
Take profit
Exit from the buy position when:
- The parabolic SAR dot appears above price candles.
- MACD histogram bars (red) appear below the middle (0.0) line.
Bearish trade setup
This strategy suggests a bearish scenario when:
- Parabolic SAR dot appears above price candles.
- The blue signal line crosses below the red signal line of the MACD window, and both head toward the downside.
- MACD red histogram bars appear below the middle (0.0) line.
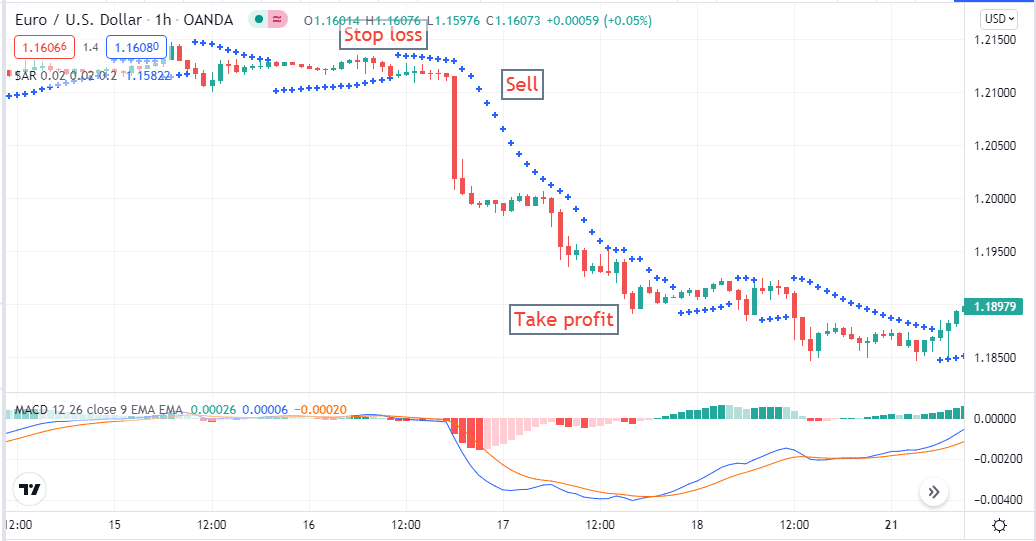
Entry
When the conditions above are true, wait until the current bearish candle closes, then place a sell order.
Stop loss
Initial stop loss will be above the recent swing high with a buffer of 5-10pips.
Take profit
Exit from the sell position when:
- The parabolic SAR dot appears below price candles.
- MACD histogram bars (green) appear above the middle (0.0) line.
Long-term trading strategy
We use the golden crossover MA 200 (blue) and EMA 50 (red) signal lines beside the RSI indicator in our long-term strategy. You will get the best setups in the daily chart of any forex asset by using this strategy.
Bullish trade setup
Suggest a bullish phase when:
- The EMA 50 (red) line crosses above the MA 200 (blue) line.
- Price candles are above both moving averages on the chart.
- RSI dynamic signal line is above the middle (0.0) line and heading upside.
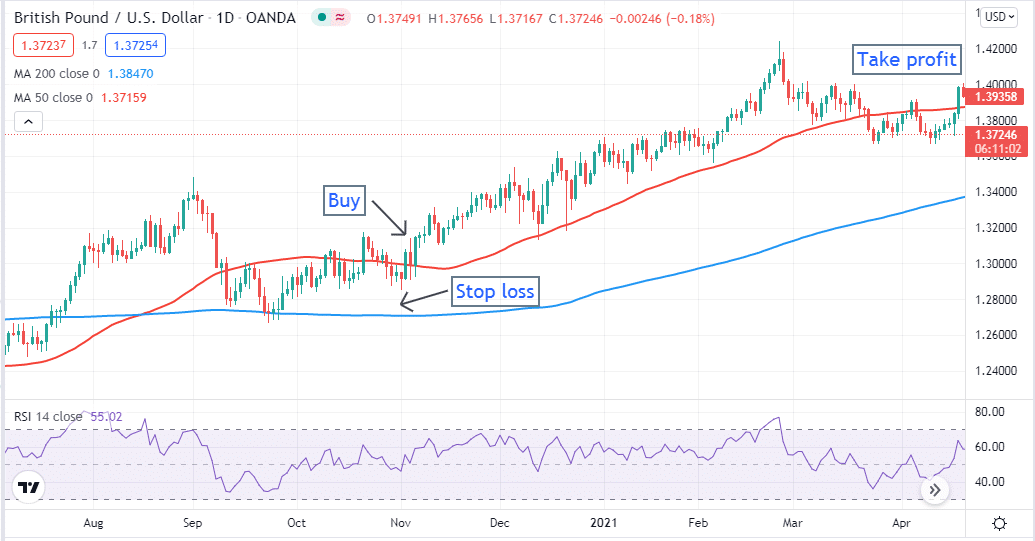
Entry
Check above conditions are true, then place a buy order after the closing of the current candle.
Stop loss
Set the stop loss below the current swing low with a buffer of 10-15pips.
Take profit
Close the buy position when:
- Price candles cross below the EMA 50 (red) line.
- RSI dynamic line heading toward the downside.
Bearish trade setup
Suggest a bearish phase when:
- The EMA 50 (red) line crosses below the MA 200 (blue) line.
- Price candles are below both moving averages on the chart.
- RSI dynamic signal line is below the middle (0.0) line and heading downside.
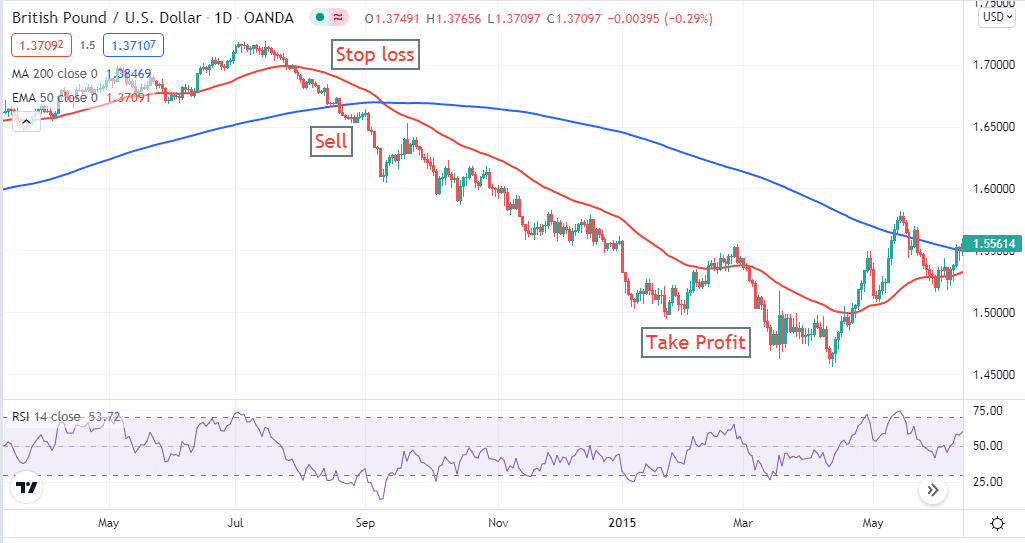
Entry
Check above conditions are true, then place a sell order after the closing of the current candle.
Stop loss
Set the stop loss above the current swing high with a buffer of 10-15pips.
Take profit
Close the sell position when:
- Price candle cross above the EMA 50 (red) line.
- RSI dynamic line heading toward the upside.
Pros and cons
| Worth to use | Worth to getaway |
| Allow getting frequent trading positions. | These strategies are only dependable on technical indicators. |
| Easily implementable strategy. | Not suitable for trading during fundamental economic events. |
| Works fine with any major currency pair that has sufficient volatility. | Indicator-based strategies always give less accurate setups than other strategies such as price action trading. |
Final thought
If you are an intraday trader, you may want to trade every trading day of the year, but some issues always come up, such as vacations, unexpected occasions, trading stress breaks, etc. So use the trading day calendar of 2022 to set your trading plan. Utilize your time carefully by trading and gradually gathering more skills of trading to become a professional trader.