Volatility is a relative fact for any financial asset. The forex market has the most liquidity, so traders often face confusion determining entry/exit positions. So measuring volatility enables trade opportunities with more profitability besides avoiding risky trades. The Average True Range is a remarkable indicator for financial traders that helps define market volatility reliably.
The ATR indicator is unique because it requires an adequate understanding and skills to obtain complete trade setups. If you want to increase your trading accuracy, there is no alternative to implementing the ATR in your method to avoid unwanted market movement.
This article will introduce you to the ATR indicator, including describing trading methods using it. Later, we list the top pros and cons of the ATR indicator.
What is the Average True Range (ATR) indicator?
Measuring volatility is essential to reduce risk in trading. It is a non-directional indicator that shows volatility results during any particular period. J. Welles Wilder, the famous technical analyst, is this technical indicator developer.
The ATR indicator uses calculations similar to the Exponential Moving average (EMA) or Relative Strength Index (RSI). Although these indicators share similarities, there are differences in calculating formulas. Financial investors use this indicator to generate buy/sell signals depending on volatility. When the volatility increases in any direction, then the ATR value increases.
Meanwhile, the ATR line declines with decreasing volume on asset price. Note that the ATR indicator doesn’t suggest or represent any trend. This indicator only represents volatility and price gaps. Determining price gaps and volatility is easy in candlestick charts, so this indicator also suits this chart type.
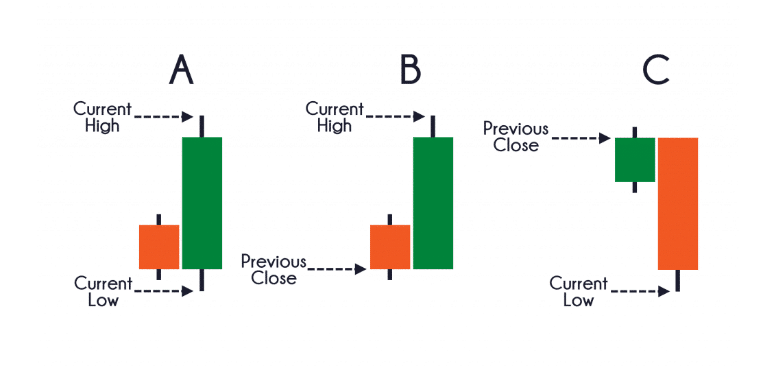
The formula this indicator use is:
ATR = (Previous ATR * (n – 1) + TR) / n
Where:
n = number of candles or periods
TR = True Range
The sum follows:
- Eliminate the current high from the previous low.
- Eliminate the current low from the previous closing price.
- Eliminate the current high from the previous low.
You achieve an adequate understanding of the ATR indicator when calculating the formulas above.
How to trade using the ATR indicator
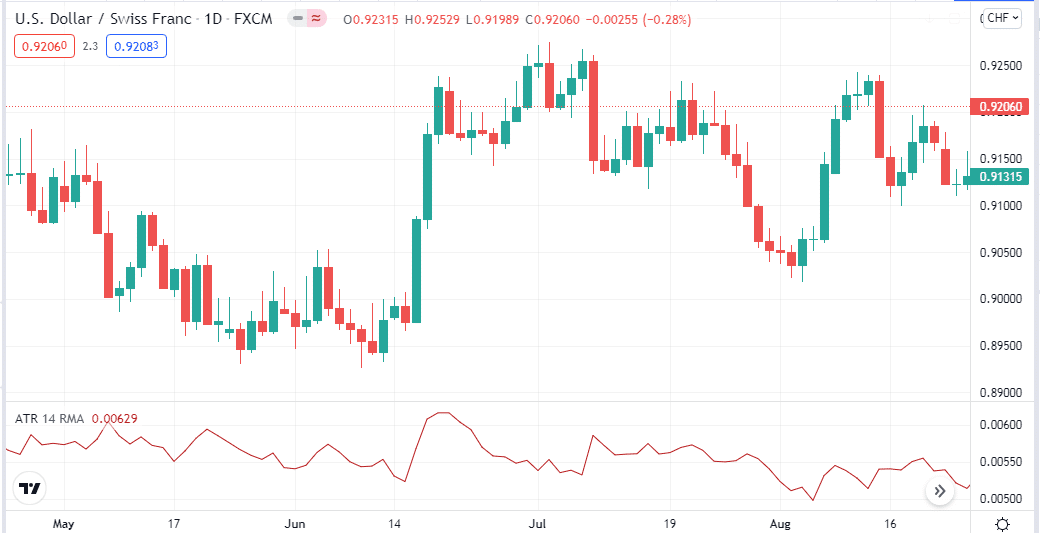
The ATR indicator allows short-term and long-term trading positions depending on several factors, such as trading instruments, investment type, return expectations, and calculations. The standard value this indicator uses is 14 periods. A reading of 10 can be used to determine short-term trading positions, and for long-term trading positions a suitable period is 20. The initial goal was to identify the volatility of commodities. Later, it is suitable for many other trading instruments, such as indices, currencies, and stocks.
A sharp rise in ATR value declares increasing volatility in the current direction; meanwhile, the ATR value declines as volatility fades or the price movement shifts direction. Using other technical indicators alongside the ATR indicator is always better to determine the most accurate trading positions. When creating trading techniques, you can use the RSI, ADX, Parabolic SAR, etc., as a supportive indicator.
A short-term trading strategy
We use an EMA crossover alongside the ATR indicator in this short-term trading method. As supportive indicators, it contains EMA 10 (green) and EMA (20) lines. When sufficient buy pressure comes up, the green EMA line crosses above the red EMA line and remains that way as the uptrend continues. Inversely, the green EMA line reaches below the red EMA with declining pressure.
Best time frame to use
This trading method suits many time frame charts. We prefer using a 15-min chart to generate short-term trading ideas on sufficient volatile assets.
Bullish trade scenario
Seek to open buy positions when:
- The bullish crossover occurs between those EMA lines.
- Both EMA lines are heading toward the upside.
- The ATR value is increasing.
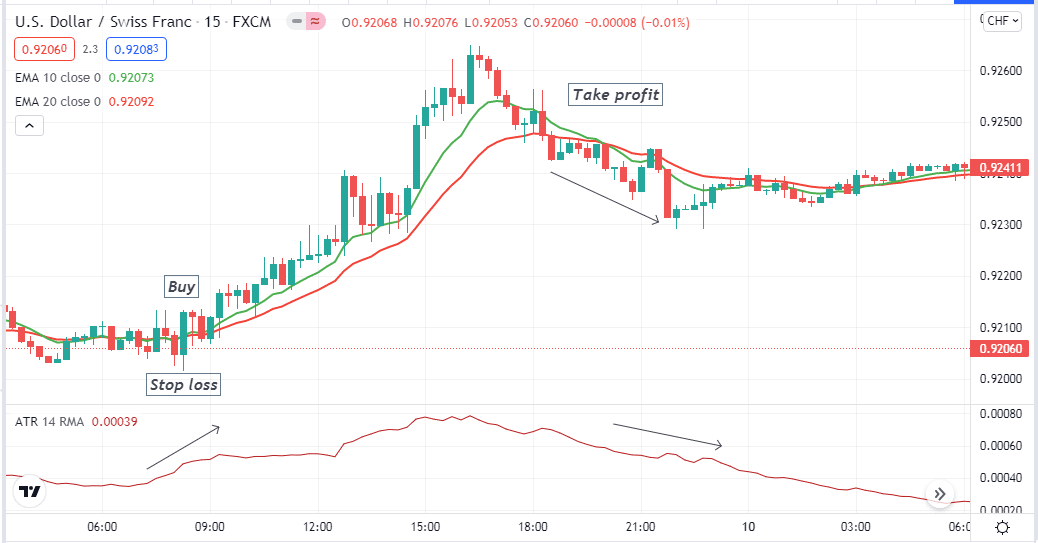
Entry
When these conditions above match your target asset chart, it signals a potential upcoming buy pressure. Place a buy order here.
Stop loss
You can place a stop loss below your buy position by multiplying the ATR value. For example, when you open your position, the ATR value is 20, then the stop loss level will be below 20X2=40 pips. Otherwise, place a stop loss below the recent swing low.
Take profit
When the green EMA line crosses below the red EMA line or the ATR value declares fading bullish pressure, close the buy position.
Bearish trade scenario
Seek to open sell positions when:
- The bearish crossover occurs between those EMA lines.
- Both EMA lines are heading toward the downside.
- The ATR value is increasing.
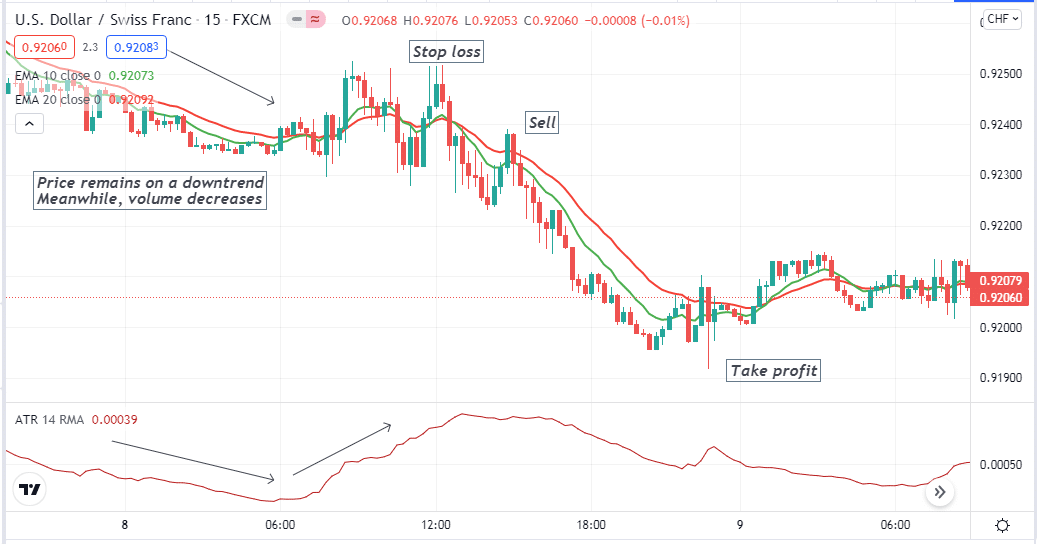
Entry
When these conditions above match your target asset chart, it signals a potential sell pressure. Place a sell order here.
Stop loss
You can place a stop loss above your sell position by multiplying the ATR value. For example, when you open your position, the ATR value is 20, then the stop loss level will be above 20X2=40 pips. Otherwise, place a stop loss above the recent swing high.
Take profit
When the green EMA line crosses above the red EMA line or the ATR value declares fading bearish pressure, close the sell position.
A long-term trading strategy
This long-term trading method involves another most popular momentum indicator, the MACD. This trading method generates trade ideas by combining MACD and the ATR readings in independent windows. It is an easy trading method. Crossovers between dynamic blue and red lines to determine trend-changing points and histogram bars of different colors on both sides of the central line of the MACD window declares trends.
Best time frames to use
An H4 or above time frame chart is recommendable for this strategy.
Bullish trade scenario
Seek to open a buy order when:
- The ATR line declares volatility.
- The dynamic blue line is above the dynamic red line of the MACD window.
- MACD green histogram bars take place above the central line.
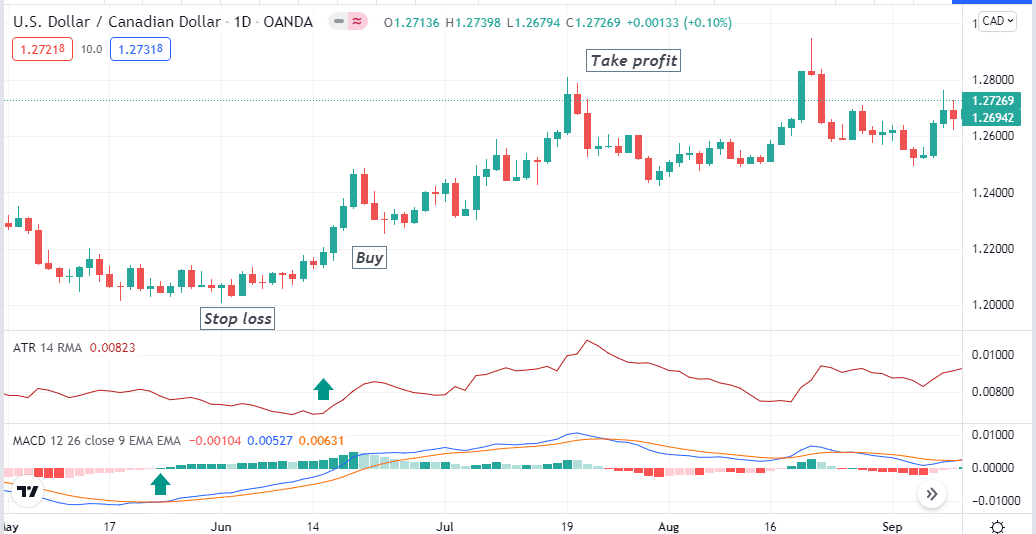
Entry
Open a buy position when those indicators readings match these conditions above.
Stop loss
You can use the ATR value to place stop-loss, or the initial stop loss level is below the recent swing low.
Take profit
Close the buy order when:
- The dynamic blue line crosses the dynamic red line on the downside.
- MACD red histogram bars take place below the central line.
- The ATR value decreases.
Bearish trade scenario
Seek to open a sell order when:
- The ATR line declares volatility.
- The dynamic blue line is below the dynamic red line of the MACD window.
- MACD red histogram bars take place below the central line.
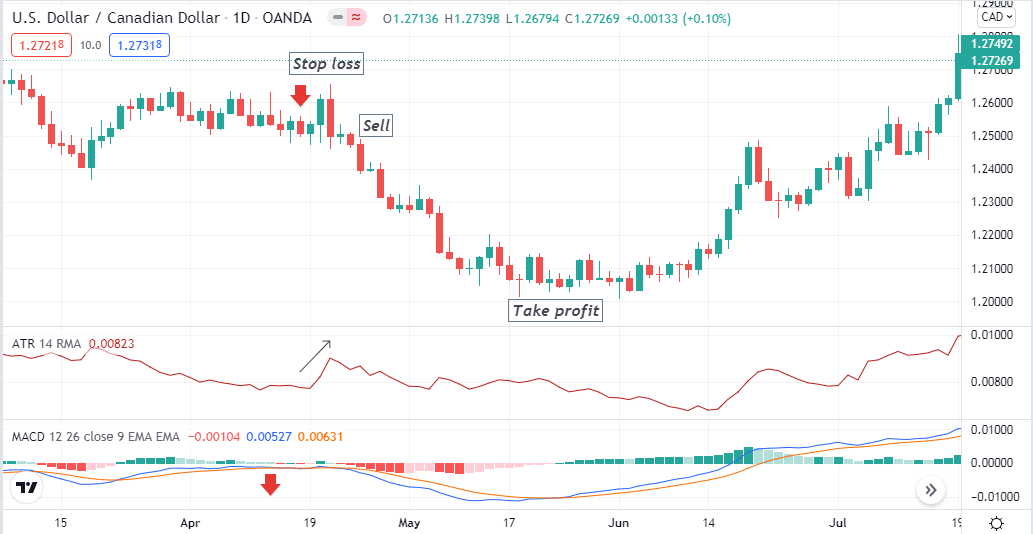
Entry
Open a sell position when those indicators readings match these conditions above.
Stop loss
You can use the ATR value to place stop-loss, or the initial stop loss level is above the recent swing high.
Take profit
Close the sell order when:
- The dynamic blue line crosses the dynamic red line on the upside.
- MACD green histogram bars take place above the central line.
- The ATR value decreases.
Pros and cons
| Pros | Cons |
| The ATR indicator allows making both short-term and long-term trades. | This indicator represents only volume. |
| A helpful indicator to enter trades with sufficient volatility. | Creating a complete trading method requires using other indicators. |
| This indicator is available on many trading platforms and suits many trading assets. | This indicator can fail due to fundamental events. |
Final thought
To become a successful trader, you must follow discipline on trade executions besides maintaining decent trade and money management rules. The volatility measurement is essential to reduce risk on trade executions. You can use the ATR indicator to reduce that risk.