Futures traders are fully aware of the inherent risk in the game. Anyone can go from one extreme to the other, regardless of their level of expertise. A self-evaluation may be warranted, though, if a cold streak seems to be ongoing.
Continuous improvement and constant self-evaluation are hallmarks of the most successful traders. Keeping this in mind, here are some tips to help you become a better future trader.
Four things to know before starting with future trading
To become a master of future trading following are a few steps that we have mentioned. Let’s start exploring them.
Step 1. Make sure you know how to read a chart
You’ll need some significant chart reading abilities unless you’re a futures investor or a long-term position trader. This does not imply that you must be familiar with all chart types, including candlesticks, point and figure, three-line breaks, and Kagi charts. It also doesn’t mean that you must be familiar with more obscure charting concepts like Elliott wave or Gann theory.
It means that you must understand:
- Which chart delivers the essential information for your trading style.
- Why it suits your trading style.
- How to alter, improve, or simplify your charts as the market scenario dictates.
When making trading choices as a day or swing trader, you will most likely depend on your charts. There are many types of charts, each depicting a distinct facet of the markets. In addition, each chart format has its own set of benefits and drawbacks. So make an informed decision.
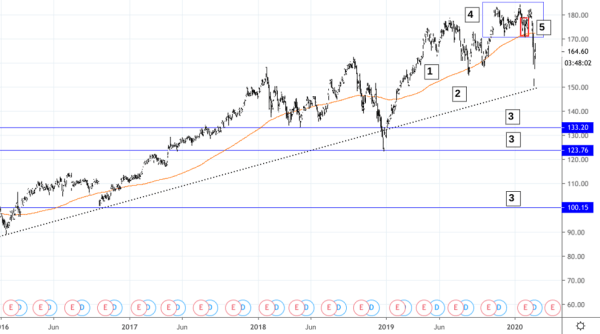
Depending on your trading strategy, you may read this chart differently.
Is this price action, which fell below its 200-day moving average [1], a bearish downtrend to you?
Or are you looking at the longer-term trend at [2], which suggests a possible bullish uptrend? Perhaps you’re paying more attention to the levels of the support level at [3].
You may have seen the bearish triple top at [4] as a swing trader.
Or did you make a mistake by betting on the bullish diamond bottom at [5]?
A chart may be interpreted in a variety of ways. And chart reading is a must-have talent for short-term traders (especially day traders–it’s a day trading skill you can’t do without). And, to compare one reading to another, you must be able to observe a chart from various perspectives.
Step 2 You’re at a major disadvantage if you can’t read price action.
Consider that using lagging indicators, like MAs, has a built-in delay that might hinder your ability to make timely decisions. Fibonacci projections, time series, Elliott Wave projections, and other predictive models may be readily disrupted by abrupt price swings that reflect real-time supply and demand adjustments.
The context around real-time price activity is the closest you’ll come to comprehending real-time markets. Current circumstances may readily alter during the day, and these adjustments might have a short-, intermediate-or long-term impact on the market.
The difficulty is to figure out which of the three outcomes is the most probable. And to do so, you’ll need the capacity to produce projections that are flexible to real-time market developments, as well as the ability to anticipate many possible outcomes.
Forecasts based on trailing or predictive models may be essentially meaningless unless you can grasp what’s going on in front of you.
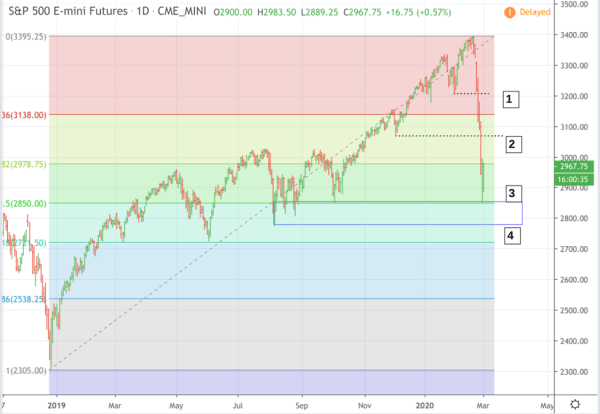
A break below the swing low at [1] implies a downtrend from a short-term viewpoint.
A break below [2] might indicate a downturn from a medium-term view.
Given the solid historical support, the rebound at [3] may have been predicted.
Furthermore, the price level at [4] represents a 50 percent Fibonacci retracement, in the long run, making the “downtrends” only pullbacks in an uptrend.
Which point of view is correct? You will not know until it occurs. However, you’ll have to study the price action to figure out how you’ll adapt.
Using each level as a price objective for short positions while purchasing call options on the 2800 strike price – that is, assuming you were confident that the markets would rebound from 2800 – you could have exploited these situations tactically. It is not trading advice, but it does show one possible method you may have traded the move based on short- to longer-term price indicators.
Step 3. Understand how to spot trend reversals and changes in trend direction
How is it that this is a lot tougher than it appears? Trend continuations and reversals are difficult to “predict” with any degree of precision. You can, however, predict them well enough to adjust to a variety of situations.
First, eliminate the most common blunders, such as conflating trends of distinct periods. Next, determine the trend period you’re trading and use at least one trend assessment method based on real-time price data. It’s essential to keep in mind that trends can only be validated by looking backward. However, forecasting their next steps and turns must be done in real-time.
An uptrend is defined by higher highs and lower lows, while lower lows and higher highs define a downtrend.
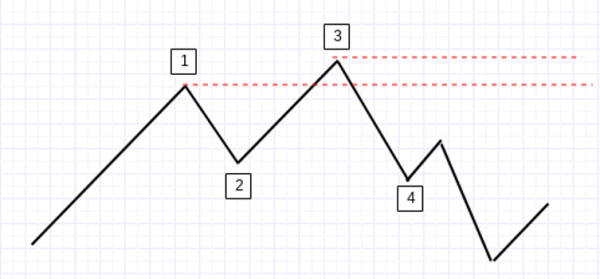
Uptrend is shown by the movements [1], [2], and [3]. A downtrend is indicated by the break below at [4]. These guidelines are straightforward to follow. The problem is that a trend comprises many, and sometimes opposing, micro and macro trends.
To put it another way, you’ll have to determine which trends to follow and which to avoid.
Step 4. Pay attention to the fundamentals that influence your trade markets
You’re trading with a significant strategic disadvantage if you don’t monitor the fundamentals impacting your trade markets. You’ll never know what hit you until after it’s happened. It was not a wise decision.
Here’s an excellent illustration of what may happen if you ignore the basics.
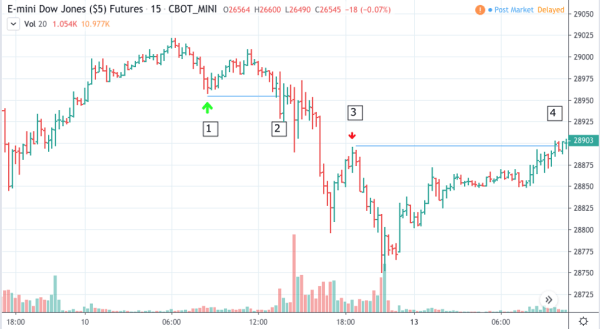
You opted to purchase a pullback at [1] since the YM had been gradually going higher over the overnight session. But, of course, traders anticipated robust blowout statistics for the December employment report at 8:30 a.m., which is why it’s been going higher. You wouldn’t have known about it if you didn’t follow the basics, and you wouldn’t have grasped the ramifications if you didn’t follow the principles.
You were stopped out at [2] because the numbers were incorrect. So you’re watching the news and see that the employment stats were off, so you decide to join the shorts at [3]. The issue is that, although the employment figures were terrible, the Federal Reserve’s stance was known to be accommodating, implying that the Fed’s stance outweighed any negative implications of the jobs data. So the markets rose again, only for you to be stopped out at [4].
In a nutshell, master the essentials. Technical analysis is tactical, but the fundamental analysis is an important strategic component of every transaction.
Final thoughts
If you’ve been trading for some time, you should consider futures markets and feel you’re ready to take your trading to the next level. To make money in the futures market, you must be disciplined and can put your skills to the test while doing so. In addition, it may be challenging to get started or get your bearings when you’re lost. Both of those concerns have been addressed in this essay. It’s tough to make money trading futures contracts, but you now have a solid foundation to create your trading strategy.