Imagine if there was a way to buy at the bottom or sell at the top without risking too much. Well, technically, there is a way. We are talking about CCI divergences.
Don’t fret if you haven’t heard of it, as in this guide, we’ll explain what CCI divergence is and how you can use it for trading. As you might have noticed, CCI divergence is a combo of CCI and divergence. So, first, we are going to define each one of them.
CCI explained
The CCI, aka Commodity Channel Index, is a technical indicator developed by Donald Lambert. He created this indicator to measure the cyclic patterns in commodities. The CCI lies in the list of momentum indicators. The special feature of momentum oscillators is that they let you find overbought and oversold levels.
The main idea behind the CCI is price moves in highs and lows in a cyclic way. If you are a trader, you can note that price doesn’t move in one direction. Instead, it creates a cyclic process jumping high and low, so you can benefit from buying and selling.
The CCI is like a BMX. It is highly effective for locating these recurring price moves. Lambert never used the indicator on assets other than commodities. But now you can apply on any market.
You probably are wondering how the indicator works?
The CCI fluctuates between -100 and +100 levels.
- When the CCI is above the 100-mark, it means that the price is entering a strong uptrend.
- When the CCI falls below -100, it tells you that the price is moving downwards.
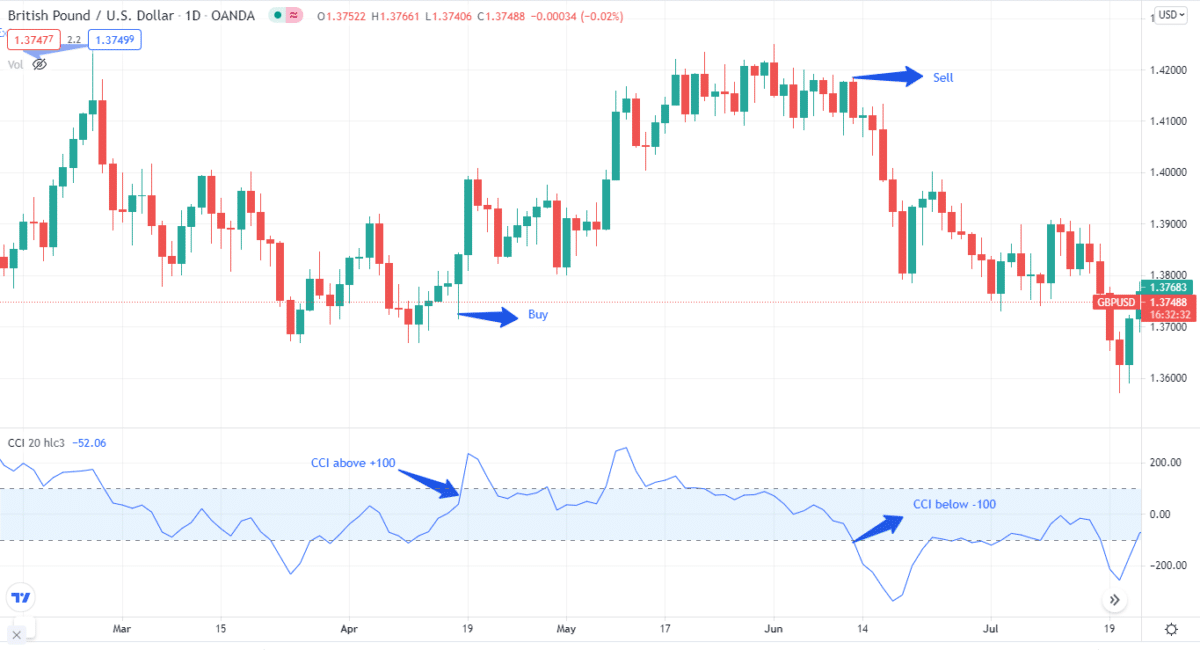
As the above chart illustrates, there is a buy signal when the CCI is above +100 and a sell signal below -100.
As we mentioned, CCI is a momentum oscillator, so when it is above +100, it is in the overbought zone. Conversely, when the CCI is below -100, it is at an oversold level.
Divergence explained
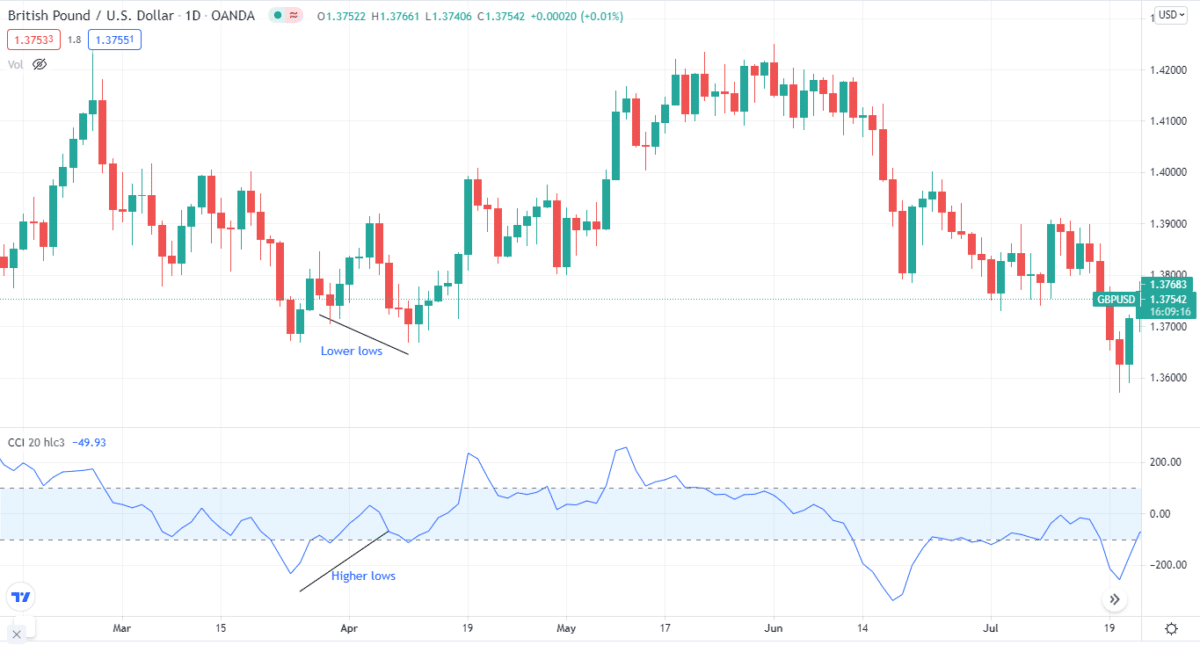
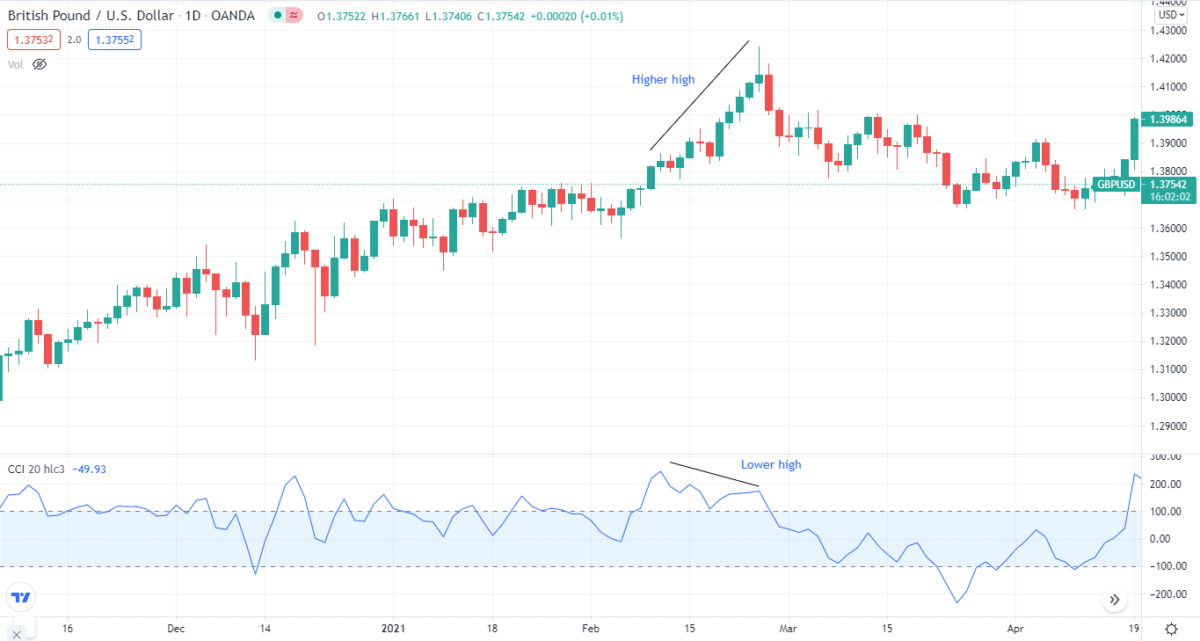
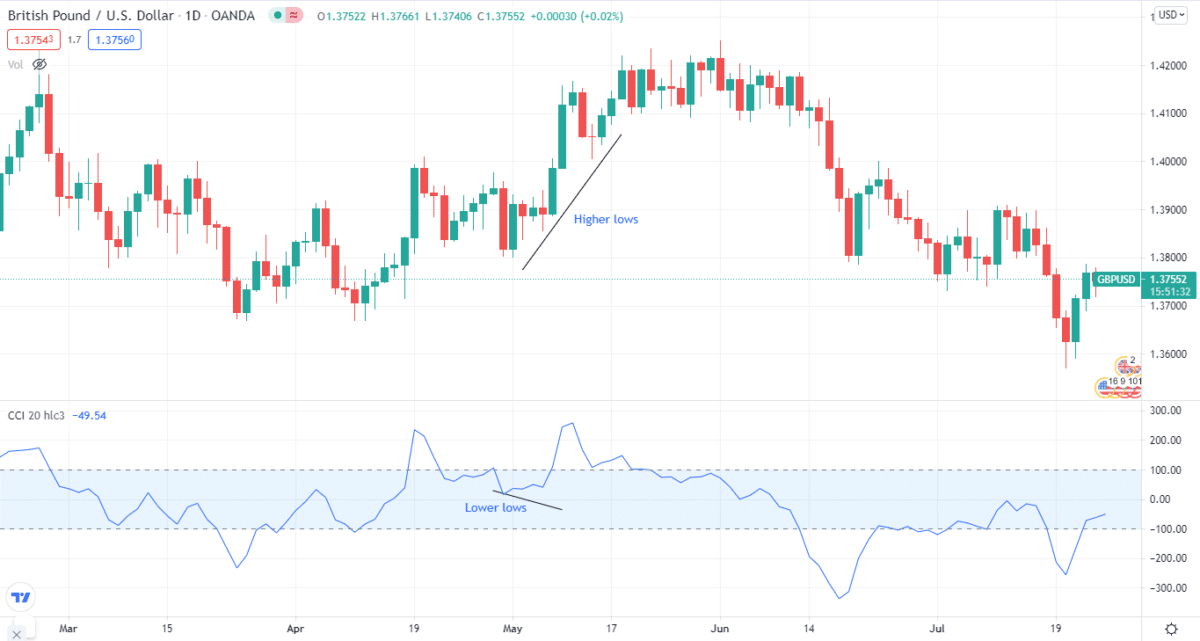
In trading, this tool mentions the opposite direction of the price in comparison with the technical indicator. Divergences use higher highs and lower lows.
A key point to add here is momentum and price are like sidekicks of each other. One can’t work without the other.
- If the price makes higher highs, momentum will make higher highs.
- If the price is making lower lows, momentum will make lower lows.
- If price and momentum don’t work with each other, this means we have divergences.
Since we are talking about momentum, the CCI is one of the best momentum oscillators. So, it works well with divergences.
There are two forms:
- Regular
- Hidden
When the price makes lower lows, and the momentum oscillator makes higher lows. Thus giving us a regular bullish divergence. And when there is a bullish divergence, you go long.
When the price marks higher highs, while the momentum oscillator marks lower highs, it is a regular bearish divergence. When there is a bearish divergence, you go short.
In a hidden divergence, the price makes higher lows, and the oscillator makes lower lows. This is a sign of bullish hidden divergence.
This is a bearish hidden divergence when the price creates a lower high and the oscillator makes a higher high.
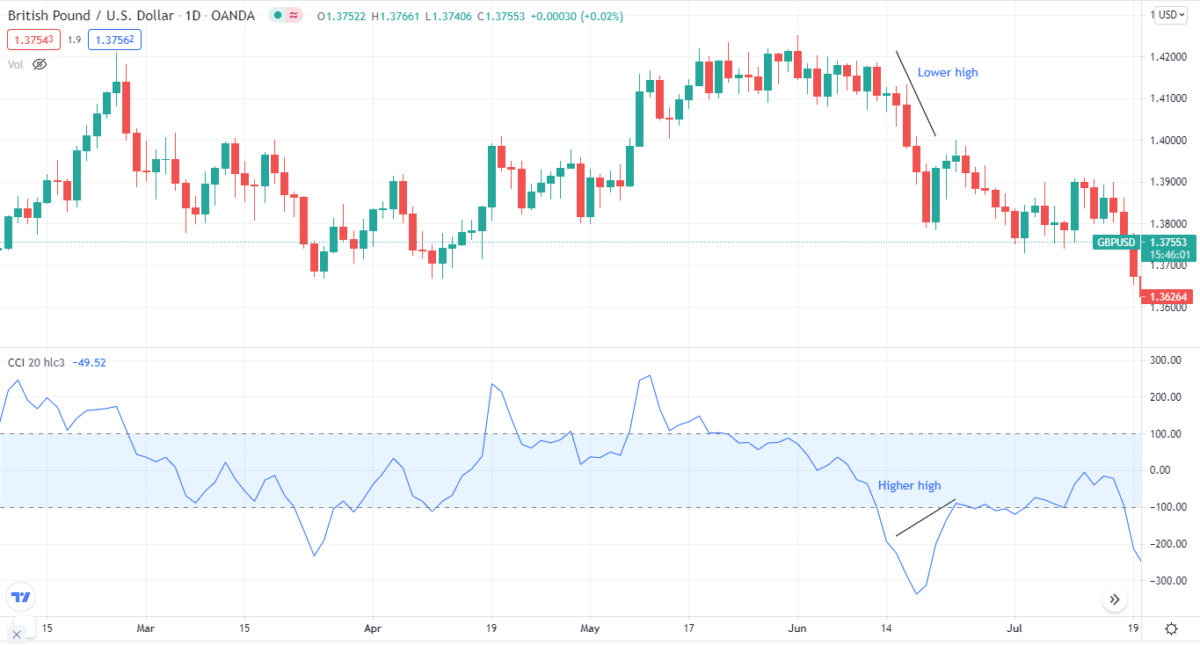
Keep in mind that when there are regular divergences, there is a chance of trend reversal. On the other hand, if there are hidden divergences, there is a possibility of trend continuation.
CCI divergence in action
Now that you know what CCI and divergences are, we can implement both as part of our strategy. You can use various momentum indicators like the RSI or stochastics to trade the types mentioned above of divergences. However, as we are eyeing CCI, we are going to use this momentum oscillator.
Besides, CCI works best with divergences, especially when you are trading FX. You can find good divergences if you can use two CCI indicators. Two is better than one, right?
But, unfortunately, the input period for these indicators works best on 10 and 60. The idea is to navigate stronger signals with these two CCI indicators. Set one CCI at 10 and the other at 60 and wait for the divergences to pop up on the chart.
There is no doubt you can use the CCI in whichever time frame you like. However, it’s better to look for signals in larger time frames. In the CCI divergence strategy, your selection of time frame will impact your overall success rate.
Pro tip: try different time frames and see what works for you.
Many traders jump right in and enter on the candle right after locating divergence for the entry points. This is a good strategy, but it’s better to wait for the price action to form. As you can see on the chart below, we waited for the price action to start, then enter our short position fully.
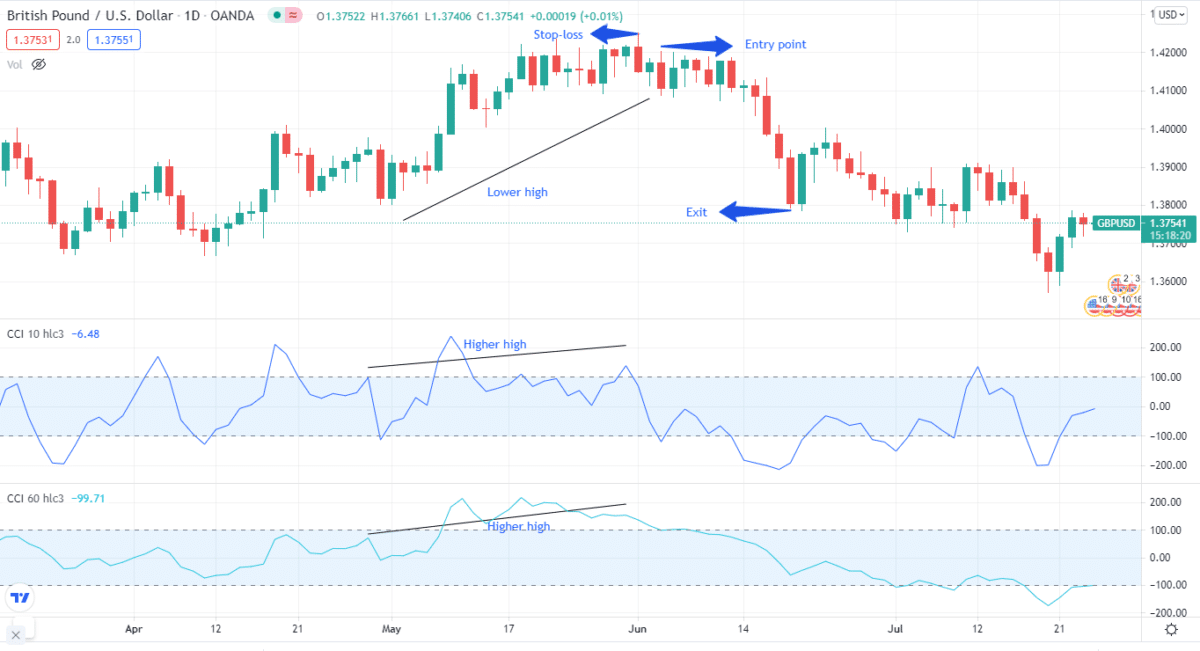
Notice that we place a stop-loss near the high of our entry point and exit when the trend changes. Can you figure out what type of divergence this is? It’s a bearish hidden divergence.
Essential tips when using CCI divergence
Here are a few critical steps you need to remember when using this tool in trading:
- You can use CCI to tweak the strategy rules to make them more aggressive or conservative. For example, this signifies that you should only take short positions on a longer time frame like we did in the example mentioned above. This helps in reducing the false signals.
- You can also adjust the entry and exit points according to your strategy. For instance, if the overall trend is downwards on the longer timeframe, you can use a shorter time frame for the CCI to drop below -100 and then wait for it to jump at the zero levels. From there, you can take a buy position. This will help you in determining the resumption of a long-term trend.
Final thoughts
So, now you know how you can use the CCI divergence in trading. First, try the strategy mentioned earlier to see if it works for you, and remember to use stop-loss while trading.